Select at least one Y column (or a range from at least one Y column). Ideally, select at least two Y columns (or a range of at least two Y columns). If there is an associated X column, X column supplies X values; otherwise, sampling interval of the Y column or row number is used.
Please note, if you want to stack some Y columns, you need set same Z value for them.
Select required data.
From the menu, choose .
or
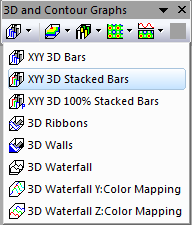
Click the XYY 3D Stacked Bars button on the 3D and Contour Graphs toolbar.
(Installed to the Origin program folder).
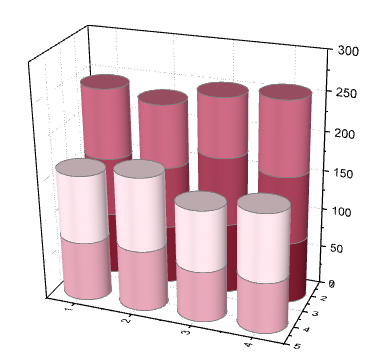
The Y value of each data point is represented as the height of a column and the Y columns with same Z value will be stacked cumulatively on Y direction.
Each XY column series has a fixed width which can be modified in the Outline tab, is labeled with its specified worksheet column label on the Z axis. And, you can specify the bar shape in the Pattern tab.