29.8.6 3D Waterfall Z:Color Mapping
Data Requirements
Select at least one Y column (or a range from at least one Y column). Ideally, select at least two Y columns (or a range of at least two Y columns). If there is an associated X column, X column supplies X values; otherwise, sampling interval of the Y column or row number is used.
Creating the Graph
Select required data.
From the menu, choose .
or
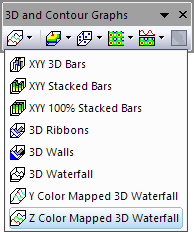
Click the Z Color Mapped 3D Waterfall button on the 3D and Contour Graphs toolbar.
Template
glWater3D.OTP (installed to the Origin program folder).
Notes
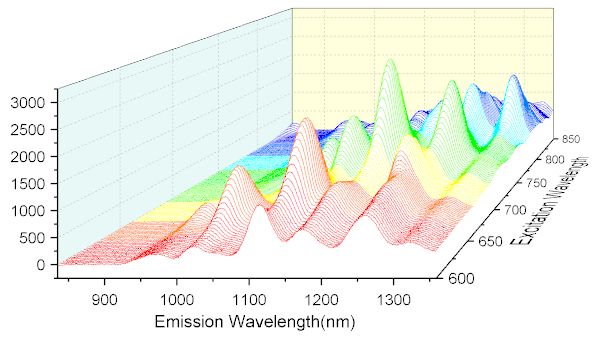
3D waterfall with Z color mapping is an OpenGL-based 3D graph:
- The Y values in each column define an XY face with white fill color.
- Color mapping is applied to the lines in Z direction.
- Typically, all XY faces are arranged in the Z direction by values stored in a column label row. If a column label row contains numeric values, these are auto-detected and used to label the Z axis. Absent a row of numeric values, other column metadata, including column headings, can be used to label the Z axis. Ultimate control is via the Z Value Source drop-down on the Miscellaneous tab (Layer level) of Plot Details.
- You can enable data labeling for 3D Waterfall plots, using controls on the Label tab of Plot Details.