31.17.12 3D Ternary Symbol
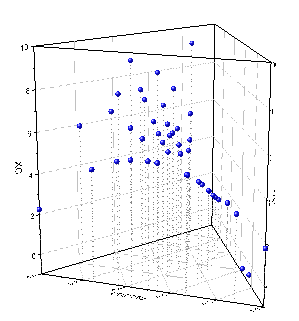
Data Requirements
Select two Z columns (XYZZ) or a range of data from two Z columns (Z columns may be multiples of 2).
Creating the Graph
Highlight the source data and
select Plot > 3D: 3D Ternary Symbol.
Template
- GLCMAPTER.otp (OpenGL only)
(Installed to the Origin program folder).
Notes
Unlike 3D graphs in the Cartesian coordinate system, there are four axes in the 3D ternary system, defined as X, Y, Z and Zh. The Zh axis is perpendicular to the plane of the triangle. Correspondingly, there will also be four axis planes: XY, YZh, ZhX and ZZh.
When you have a 3D ternary colormap surface plot, you can open the Plot Details dialog box (select Format: Plot) and change the Plot Type to 3D Scatter/Trajectory/Vector plot, to get a 3D scatter plot in the 3D ternary coordinate system. You can also add a 3D ternary scatter plot to an existing 3D ternary surface from the Layer Contents dialog.
Unlike 3D ternary colormap surface, with a 3D scatter plot, you could not only use a color scale as the legend, but also add other legend objects to the graph, such as the default legend, legend for categorical values and point by point legend.
The plot designation syntax in the legend substitution of 3D ternary scatter plot should then be X, Y, Z and Zh, and by default Zh will be used.