Select at least one Z column (or a range from at least one Z column). If the Z column has associated XY columns, then the XY columns are used; otherwise, the worksheet's default XY values are used.
Matrix: A matrix of Z values, at least with one object..
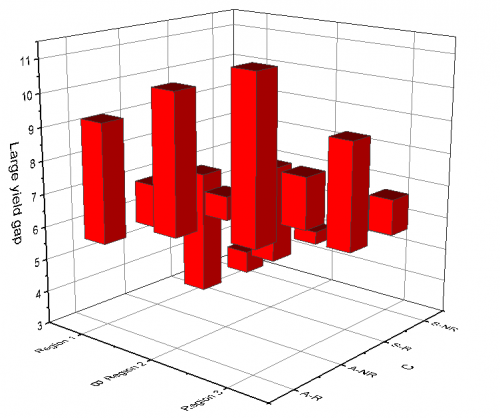
Creating the Graph
Activate the matrixsheet or select required data from worksheet.
From the menu, choose Plot > 3D: 3D Floating Bar.
Template
GL3DFLOATCOL.OTPU
(Installed to the Origin program folder).
Notes
For XYZ data, the two Z values at same X and Y coordinates will be used as start and end of the bar; for matrix data, two objects in current matrixsheet will be used as start and end of the bar. If the first Z value is larger than the second one, the bar height will be Z1-Z2 and the direction is upward; If the first Z value is smaller than the second one, the bar height will be Z2-Z1 and the direction is downward.
The associated X and Y values mapped in the matrix/worksheet determine the XY locations of each floating column.