31.5.2 3D Color Pie Chart
Data Requirements
Select exactly one Y column of values (or a range from one column).
Creating the Graph
Select required data.
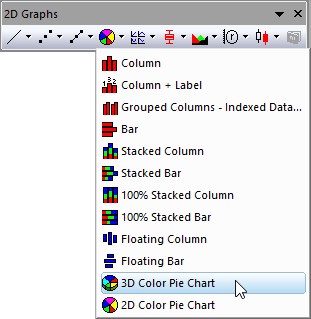
From the menu, choose .
or
Click the Pie Chart button on the 2D Graphs toolbar.
Template
PIE.OTP (installed to the Origin program folder).
Notes
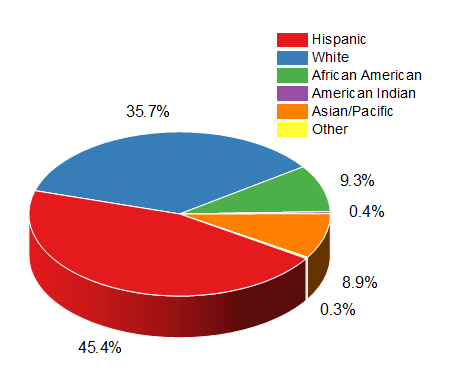
The selected values are summed, and the percentage of the total is determined for each selected value. The pie chart displays the percentage of the total for each selected value as a pie section.
Since Origin 2020, Origin's 3D pie chart supports to
- Set the thickness and radius of the wedges to be incremental
- Reorder the wedges
- Explode one or more wedges from the pie.
- Combine wedges by specifying a threshold percentage/value or your custom selection.
- Show all wedges as a incomplete pie.
- Set the thickness of wedges to be incremental.
- Set the radius of wedges to be incremental
Reference
To customize the viewing angle, rotation,radius and center, see The (Plot Details) Pie Geometry tab.
To customize the wedges, such as exploding and combining the wedges, see The (Plot Details) Wedges Tab.
To customize the labels of wedges, see The (Plot Details) Labels tab.