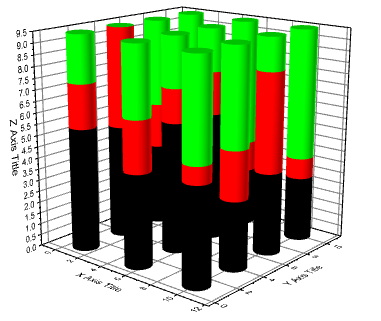
31.17.8 3D 100% Stacked Bar Graph
Data Requirements
- Worksheet:
- Select at least one Z column (or a range from at least one Z column). If the Z column has associated XY columns, then the XY columns are used; otherwise, the worksheet's default XY values are used.
- or
- A block of worksheet cells (virtual matrix)
or
- Matrix: A matrix of Z values, at least with one object..
Creating the Graph
Activate the matrixsheet or select required data from worksheet.
From the menu, choose .
or
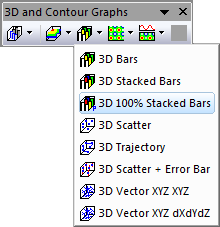
Click the 3D 100% Stacked Bars button on the 3D and Contour Graphs toolbar.
Template
- gl3DStackBarP.OTP (OpenGL)
(Installed to the Origin program folder).
Notes
- The Z values determine the height of the columns (bars).The columns/bars can be color-mapped to the Z values.
- The associated X and Y values mapped in the matrix/worksheet determine the XY locations of each column.
- For XYZ data, the Z values at same X and Y coordinates will be stacked on Z direction; for matrix data, all objects in current matrixsheet will be stacked.
- If you want to create such 3D stacked bar graph from virtual matrices, you need create a general 3D bar graph from a selected virtual matrix firstly, and then add more virtual matrices into this graph with Layer Contents dialog. Please note, subsequent virtual matrices need be created in advance with X-Function w2vm.
|
This graph type can also be created from a 3D Stacked Bars Graph, by selecting the Normalize to Percent for Cumulative box on the Stack tab of the Plot Details - Layer Properties dialog box. |