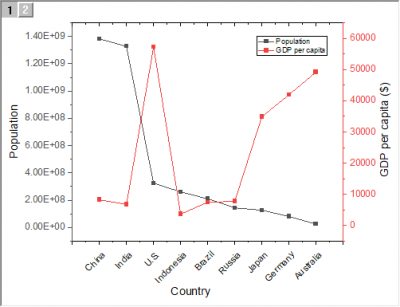
31.6.8 2Ys Y-Y Graph
Data Requirements
Select at least two Y columns (or a range of at least two Y columns). If there is an associated X column, X column supplies X values; otherwise, sampling interval of the Y column or row number is used.
Multiple Y columns will be sepereated into 2 groups by 2 X columns; otherwise, these Y columns will be assigned to different Y axis by sequence.
Creating the Graph
Select the required data.
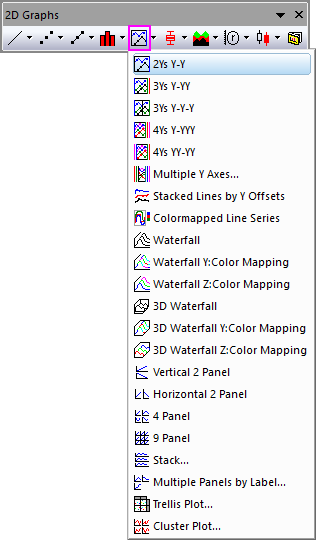
Select .
or
Click the 2Ys Y-Y button on the 2D Graphs toolbar.
Template
DOUBLEY.OTP (installed to the Origin program folder).
Notes
The double Y axis graph contains two layers:
- Layer 2 is linked to Layer 1.
- The X axis in layer 2 has a straight one-to-one link with the X axis in layer 1.
If two columns of values are selected (or a range of two columns), then one data plot displays in each layer. Each data point in the data plot is connected by a line. The default line connection between points is a straight line. The data points are displayed as symbols.
Creating an XYXY graph using the Double-Y template
You can quickly create an XYXY graph from the same Double-Y graph template:
- Select your XYXY columns and choose Plot > Multi-Panel/Axis: 2Ys Y-Y.
- In the graph window, right-click on the Layer 2 icon and choose Layer Properties...
- In the Plot Details dialog box, click the Link Axes Scales tab (Layer 2) and set X Axis Link to None and click OK.
- Double-click the top axis and on the Tick Labels tab of the Axis dialog, check the Show box.
- On the Scale tab, set From and To values and click OK; or close the Axis dialog box and click the Rescale button
 on the Graph toolbar.
|
Note: To plot Double-Y graph into one single layer, you can use this newly-implemented template "Double Y". |