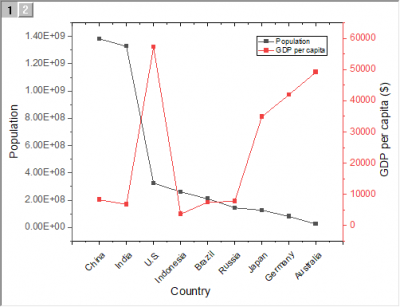
Select at least two Y columns (or a range of at least two Y columns). If there is an associated X column, X column supplies X values; otherwise, sampling interval of the Y column or row number is used.
Multiple Y columns will be sepereated into 2 groups by 2 X columns; otherwise, these Y columns will be assigned to different Y axis by sequence.
Select the required data.
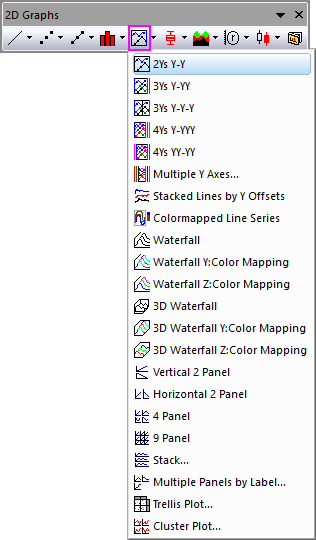
Select .
or
Click the 2Ys Y-Y button on the 2D Graphs toolbar.
DOUBLEY.OTP (installed to the Origin program folder).
The double Y axis graph contains two layers:
If two columns of values are selected (or a range of two columns), then one data plot displays in each layer. Each data point in the data plot is connected by a line. The default line connection between points is a straight line. The data points are displayed as symbols.
Creating an XYXY graph using the Double-Y template
You can quickly create an XYXY graph from the same Double-Y graph template:
|
Note: To plot Double-Y graph into one single layer, you can use this newly-implemented template "Double Y". |