31.9.1 2D Kernel Density Plot
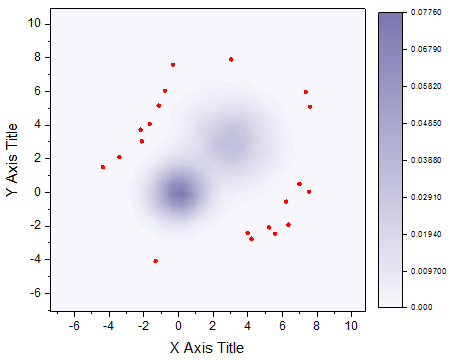
Data Requirements
Select one Y column or a XY column range from a worksheet.
Creating the Graph
Select required data.
From the menu, select .
or
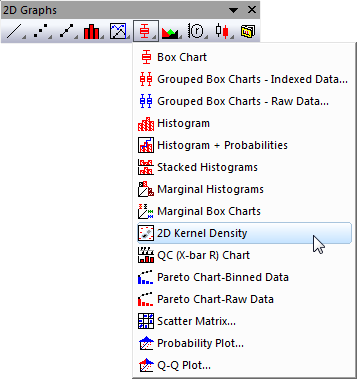
Click the 2D Kernel Density button on the 2D Graphs toolbar.
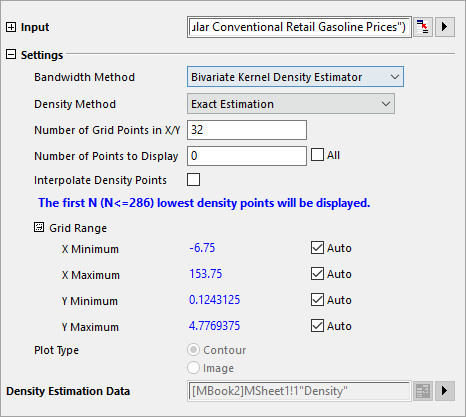
Origin opens the plot_kde2 dialog box.
Template
kdCONTOUR.OTP (installed to the Origin program folder)
Notes
For information about the creating and calculation of the 2D Kernel Density plot, please refer to 2D Kernel Density plot.