![]() See more related video:2D Binning
See more related video:2D Binning
![]() See more related video:2D Binning
See more related video:2D Binning
| Recalculate |
Controls recalculation of analysis results
For more information, see: Recalculating Analysis Results |
|---|
For help with range controls, see: Specifying Your Input Data
| Range1 |
|
|---|
Use this branch to specify the X binning range. The minimum and maximum X values are displayed to the right of the node.
| Specify Binning Range by |
Specify the way to define the X binning range.
|
|---|---|
| Minimum Bin Beginning |
Specify the minimum X bin starting value. |
| Maximum Bin End |
Specify the maximum X bin ending value. |
| Step by |
Specify bin construction, including Bin Size and Number of Bins. |
| Bin Size |
Specify the fixed step size for X bins. |
| Number of Bins |
Generated automatically by the bin range and increment. |
| Periodical |
Specify whether or not the data is periodic. |
| Period |
Specify a period for the data. Control available when Periodical is checked. |
| Border Options |
|
| Output Binning Order |
Specify the sort order of the bin data output.
|
Settings for Y binning range.
| Specify Y Binning Range by |
Specify the parameter that defines the Y binning range.
|
|---|---|
| Minimum Bin Beginning |
The minimum value for the lowest Y bin. |
| Maximum Bin End |
The maximum value for the lowest Y bin. |
| Step by |
Specify bin construction, including Bin Size and Number of Bins. |
| Bin Size |
Specify the fixed step size for Y bins. |
| Number of Bins |
Generated automatically by the bin range and increment. |
| Periodical |
Specify whether or not the data is periodic. |
| Period |
Specify a period for the data. It is available when Periodical is checked. |
| Border Options |
|
| Output Binning Order |
Specify the sort order of the bin data output.
|
Compute selected bin statistics.
| Minimum | Output minimum for each bin. |
|---|---|
| Maximum | Output maximum for each bin. |
| Mean | Compute and output mean for each bin. |
| Median | Output median for each bin. |
| Sum | Compute and output sum for each bin. |
| Count | Compute and output count for each bin. |
| Percent Frequency | Compute and output percent frequency for each bin. |
Available when an option other than Count is chosen from the Quantity to Compute drop-down list. Select a column to compute the Quantity to Compute. The Customized option allows choosing an arbitrary column in the current worksheet.
Available only when Column to Compute Quantity = Customized. Allows you choose an arbitrary column in the current worksheet.
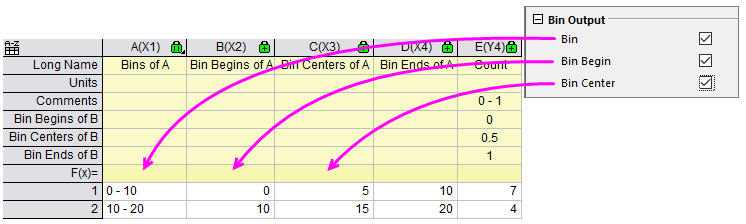
Specify whether to output the Bin, Bin Begin and Bin Center/Bin End for specified X Binning Ranges. By default, these three boxes are not checked.
Output results to a worksheet.
Available when two conditions are met:
Output the subtotal count for each binned Y to the Output Worksheet.
Output the result to a matrix.
Available when Output Matrix is selected.
| 3D Bars |
Plot a 3D bar graph from the output matrix. |
|---|---|
| Image Plot |
Plot an image plot from the output matrix. |