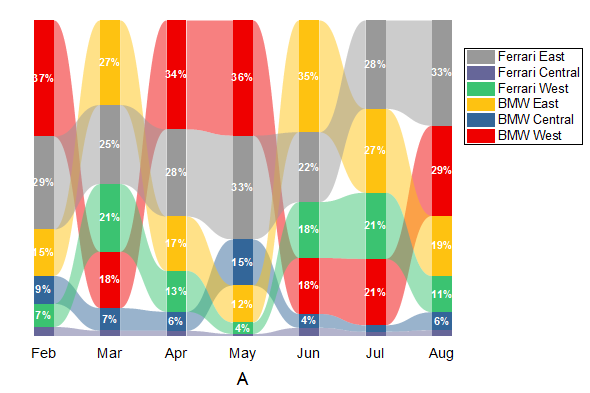
31.4.10 100% Ribbon Chart
Data Requirements
Select at least two Y columns of values (or a range from at least two columns). If there is an associated X column, X column supplies X values; otherwise, sampling interval of the Y column or row number is used.
Creating the Graph
Select required data.
From the menu, select .
Template
RibbonChartP.OTPU (installed to the Origin program folder).
Notes
100% Ribbon chart is a variant of 100% stacked column chart with ribbons as connect lines actually. You can customize the ribbons in the Line tab of Plot Details dialog.