3.10 Simulate DAQ
This example shows you how to send the simulated data to Origin worksheet and plot it dynamically both in Origin and LabVIEW.
This example is composed of three parts.
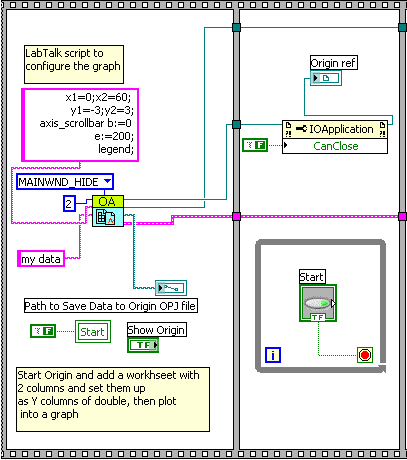
- The following part is to start Origin and add a workshseet with 2 columns. Then set the 2 columns' plot designation as Y and specify the data type of to double and plot them into a graph.
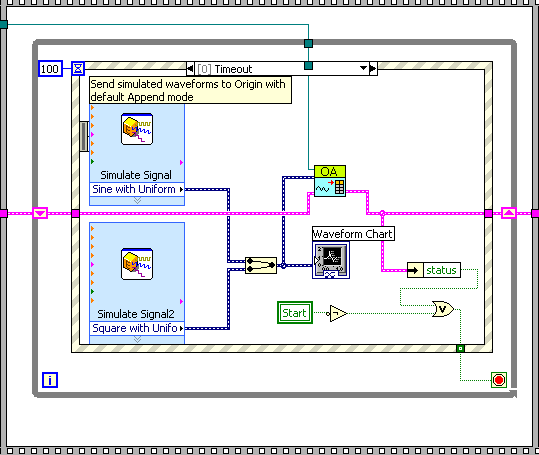
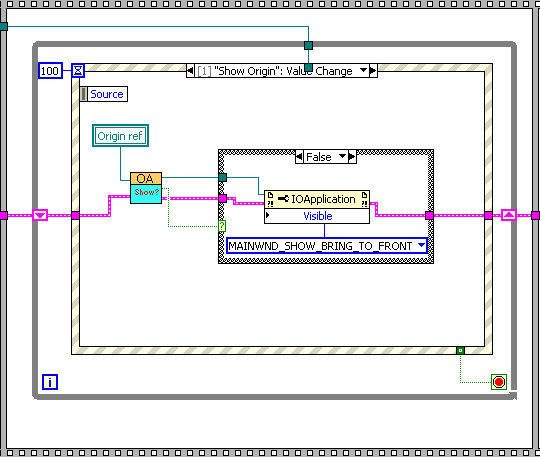
- The following part is an event structure which contains two events.
- Timeout event: If this event is triggered, the LabView will generate the data and send it to an Origin worksheet and a LabView chart.
- "Show Origin" Value Change event: If this event is triggered, Origin application will be shown. And the simulated data will be show in graph simultaneously.
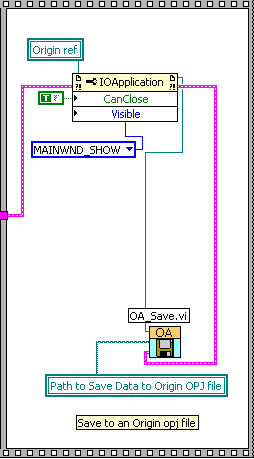
- The following part is to show final data in Origin and save the data.