4.2.1 General Plotting Examples
Contents
LabTalk Plotting Examples
plotgroup
The plotgroup function creates 'graph groups' with 'layer groups' with 'dataplot groups' where variables (datasets) are used to determine the groups for each. To work properly, the worksheet should be sorted by the graph group data first, then the layer group data and finally the dataplot group data.
/*
This example shows how to plot by group
The sample data is exe_path\Samples\Statistics\body.dat
1. Load sample data.
2. Sort worksheet.
3. Plot graphs.
*/
// Get the sample data
fn$ = system.path.program$ + "Samples\Statistics\body.dat";
newbook;
impASC fn$;
// Sort worksheet - sorting is very important
wsort bycol:=3;
// Plot by group
plotgroup iy:=(4,5) pgrp:=Col(3);

/* This next example creates graph windows based on one group
 and graph layers based on a second group
*/
// Bring in Sample data
fn$ = system.path.program$ + "Samples\Graphing\Categorical Data.dat";
newbook;
impASC fn$;
// Sort
dataset sortcol = {4,3}; // sort by drug, then gender
dataset sortord = {1,1}; // both ascending sort
wsort nest:=sortcol ord:=sortord;
// Plot each drug in a separate graph with gender separated by layer
plotgroup iy:=(2,1) pgrp:=col(drug) lgrp:=col(gender);
Note : Each group variable is optional. For example, you could use one group variable to organize data into layers by omitting Page Group and Data Group. The same sort order is important for whichever options you do use.
plotmatrix
The plotmatrix function creates a Scatter Matrix plot. Each data member is plotted as Y against every other member as X. The resulting plots are put into a worksheet grid. Options are available to include a confidence ellipse and to do a linear fit of each plot and report the correlation coefficient.
// Create a Scatter Matrix using columns 2, 3 and 5 of the specified Worksheet
newbook na:=PlotMatrixEX op:=1;
wo -a 3;   // Add 3 columns
col(1)=data(1,30);
col(2)=uniform(30);
col(3)=normal(30);
col(4)=uniform(30);
col(5)=col(3);
plotmatrix
  irng:=[PlotMatrixEX]Sheet1!(2,3,5)
  ellipse:=1
  conflevel:=50
  fit:=1;

// Here we create a new book with sheets for our data and our graphs.
// We then use this same book for gathering Scatter Matrix results
// for columns 1 and 2 in all sheets in our source book.
newbook na:=PMEx2 op:=1;
repeat 3 newsheet;
loop(ii,1,4) {
    page.active = ii;     // for each sheet
    col(1) = uniform(25);
    col(2) = uniform(25);
}
for( ii = 1 ; ii <= 4 ; ii++)
{
  range rData = [PMEx2]$(ii)!(1,2);
  plotmatrix
  irng:=rData
  ellipse:=1
  conflevel:=50
  fit:=1
  rd:=[STATS]MyScatterData
  rt:=[STATS]MyScatterGraphs;
}
plotstack
The plotstack function is used to create stacked plots from multiple datasets.
// Bring in some Sample data
newbook;
string fn$ = system.path.program$ + "Samples\Graphing\Linked Layers 1.dat";
impasc fname:=fn$;
%N = %H;
// Create a Stack plot of all columns vs column 1
plotstack iy:=(1,2:end) plottype:=line link:=1 xlink:=1;

// Create stack plot of column 2 vs. column 1 and column 4 vs. column 3
win -a %N;
plotstack iy:=((1,2), (3,4)) plottype:=column link:=0;

// We can specify a template to use, but this template should be a single layer template
// as the function loads one instance of the template for each dataset.
// Plot Type should match your template if you wish to use its style holder.
win -a %N;
plotstack iy:=((1,2),(1,3),(1,4)) plottype:=3 template:=column;
plotxy
The plotxy function is for general purpose plotting. Here are some examples:
// Begin with three sheets of six columns of data
// to be used in Examples 1 to 4
newbook sheet:=3;
string bkName$ = %H;
loop(ii,1,page.nlayers) {
    page.active = ii;
    wo -a 4;
    col(1) = data(1,30);
    col(2) = uniform(30);
    col(3) = normal(30);
    col(4) = 2 * col(2);
    col(5) = 3 * col(3);
    col(6) = col(5) / col(4);
}

////////// Example 1 ////////////////////////////////////////
// Plot the third column of the active Worksheet
plotxy 3;
page.label$ = plotxy 3;

////////// Example 2 ////////////////////////////////////////
// Plot columns 3, 4 and 5 of the active Worksheet
win -a %(bkName$); // Make Book active because plotxy does not specify Book
plotxy 3:5;

// Plot columns 3, 4 and 5 of Sheet2 against column 2 as X
// Uses default to add new graph layer to active graph window
plotxy [bkname$]Sheet2!(2,3:5); // plotxy specifies Book and Sheet so does not need to be active

// Re-arrange our two layers
layarrange row:=2 col:=1 ygap:=7 left:=12 right:=12 top:=10 bottom:=15;
page.label$ = plotxy 3:5 and [%(bkname$)]Sheet2!(2,3:5);

////////// Example 3 ////////////////////////////////////////
// Use special notation to
//    plot all y in a range : (?,1:end)
//    create a named graph from a template : [<new template:=column.otp name:=MyGraph>]
plotxy [bkname$]Sheet3!(?,1:end) pl:=230 ogl:=[<new template:=column.otp name:=MyGraph>];
page.label$ = plotxy [%(bkname$)]Sheet3!(?,1:end) pl:=230 ogl:=[<new template:=column.otp>];

////////// Example 4 ////////////////////////////////////////
// You can use variables
win -a %(bkname$);
range rSheet = $(page.active)!;
range rPage = rSheet.GetPage()$;
for( ix = 1 ; ix < int(rSheet.NCOLS) ; ix += 2 )
{
   plotxy [%(rPage.name$)]%(rSheet.name$)!($(ix),$(ix+1)) ogl:=1;
}

// Group the datasets in the layer to auto-color increment
layer -g;
page.label$ = Using variables with plotxy;

////////// Example 5 ////////////////////////////////////////
// Start with new data
newbook template:=origin.otw;
impasc fname:=system.path.program$+"Samples\Curve Fitting\Activity.DAT" option.names.FNameToBk:=0;

// Remember our book and sheet names
string bkname$ = page.name$;
string shname$ = layer.name$;

// Plot 3 ranges of column B into a specified graph template
plotxy [bkname$]shname$!((1,2[1:6]),(1,2[7:12]),(1,2[13:18])) plot:=202 ogl:=[<new template:=doubley name:=SamplePlot>];

// Add 3 ranges of column C to the second layer of the template
plotxy [bkname$]shname$!((1,3[1:6]),(1,3[7:12]),(1,3[13:18])) plot:=202 ogl:=2;

// Rescale
layer1.x.from = 2;
layer1.x.to = 30;
page.label$ = Multi-range plot;

// Show all our graphs
doc -e W {
    win -i;
}
win -s T;
// Plots a grouped plot where X values come from 1st worksheet
// and Y values come from 2nd sheet.
// Both sheets should have the same number of columns!

// Save name of active workbook.
string sbook$ = %H;

// Number of cols in active sheet.
int num_cols = wks.ncols;

// Create a new graph.
win -t plot;

// Iterate through number of columns.
for (int ii = 1; ii <= num_cols; ii++)
{
	// Add a plot to the 1st layer of the new graph using
	// column index ii from sheet 1 as X and column index ii
	// from  sheet 2 as Y.
	plotxy iy:=[sbook$](1!$(ii), 2!$(ii)) plot:=201 ogl:=!1;
}

// Finally group the plots in the layer.
layer -g;
plotxyz
X-function plotxyz is used to generate 3D plots from XYZ worksheet data. Examples follow:
////////// Example 1 ////////////////////////////////////////
//This example shows how to plot a 3D bar from discrete columns.
//Import the data file
string fn$=system.path.program$ + "\Samples\Statistics\automobile.dat";
impasc fname:=fn$;
//Set column types
wks.col3.type=6;
wks.col4.type=4;
wks.col6.type=1;
//Select columns from worksheet to generate 3D bar plot
plotxyz iz:=(4,6,3) plot:=242 ogl:=<new template:=gl3dbars>;
//Turn off the speed mode and refresh the graph.
layer.maxpts=0;
doc -uw;

////////// Example 2 ////////////////////////////////////////
//This example will create a 3D colormap surface plot and generate a projection contour in the top.
//Import the data file
string fn$=system.path.program$ + "\Samples\Graphing\Gaussian Surface.dat";
impasc fname:=fn$;
//Set the third column as Z
wks.col3.type=6;
plotxyz iz:=3 plot:=103 ogl:=<new template:=glcmap>;
layer -ip103 %c;
range rr = 2;
set rr -spf 1;
set rr -spz 100;

////////// Example 3 ////////////////////////////////////////
//The following example will plot three sub-ranges into one graph layer as 3D scatter.
//Import the data file
string fn$=system.path.program$ + "\Samples\Statistics\Fisher's Iris Data.dat";
impasc fname:=fn$;
//Set the third column as Z
wks.col3.type=6;
//Define the sub ranges
range r1=col(3)[1:50];
range r2=col(3)[51:100];
range r3=col(3)[101:end];
//Plot the 3D scatters respectively into the same layer
plotxyz iz:=r1 plot:=240 ogl:=<new template:=gl3d>;
plotxyz iz:=r2 plot:=240 ogl:=[%H]1!;
plotxyz iz:=r3 plot:=240 ogl:=[%H]1!;
legendupdate;
plotm
X function plotm plots a matrix into graph with a template customized by user.
newbook name:=MyMatrix mat:=1;
matrix -v x^2-y^2;
plotm im:=<active> plot:=103 ogl:=<new template:=glcmap>;
The colormap of the 3D surface plot can be set from another matrix object by using set %C -b3c command.
newbook name:=CMap mat:=1;
matrix -v 10*x+10*y;    //setup the matrix for colormap surface
newbook name:=MyMatrix mat:=1;
matrix -v x^2+y^2;	//setup the matrix for surface
plotm im:=<active> plot:=103 ogl:=<new template:=glcmap>;  //plot the surface matrix into 3D colormap surface

range rr=[Cmap]1!1;  //define the range
set %C -b3c rr;  //set the color map from anther matrix object
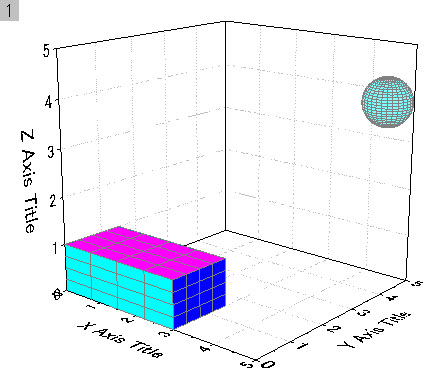
plot 3D box and sphere using plotm
The following code sample creates a 3D boxes and a sphere in a 3D layer. The box has six walls, and each wall is plotted as a 3D parametric function of a plane by plotm. Mesh is enabled. The sphere is plotted with a specific radius and at the coordinates.
//////////////////////////////////// Plot3DSphere /////////////////////////////////////////
function int plotSphere(ref string gg$, double dXc, double dYc, double dZc, double dR) {
	type -a Sphere  Center:{$(dXc), $(dYc), $(dZc)}, Radius:$(dR);
	int newg = exist(gname$)==3?0:1;
	string enu$, bk$;
	int npts = 30;//square matrix dim
	create myx3 -fp2 npts "dR*sin(v)*cos(u)+dXc" -pi/2 pi/2 npts 0 2*pi;
	create myy3 -fp2 npts "dR*cos(v)*cos(u)+dYc" -pi/2 pi/2 npts 0 2*pi;
	create myz3 -fp2 npts "dR*sin(u)+dZc" -pi/2 pi/2 npts 0 2*pi;
	create FunSphere -mfp myz3 myx3 myy3 "u,v";
	enu$ = mid(%H,10)$;  //obtain the enumeration part, %H holds the newly created active matrix window name
	bb$="FunSphere"+enu$;
	window -ch 1;  //hide matrix window
	if(exist(gg$)==3)  //graph existed
		plotm im:=[%(bb$)]1!1 plot:=103 x:=2 y:=3 ogl:=[gg$]1!;
	else
		plotm im:=[%(bb$)]1!1 plot:=103 x:=2 y:=3;   //for lighting, use template with "ogl:=<new template:=EllipsoidLTCyan>" option
	set %(bb$) -b3cc  22;  //color: 22=LT Cyan
	set %(bb$) -b3m 1;//0:No mesh, 1:Mesh
	return 0;
}

//////////////////////////////////// plotOneSide /////////////////////////////////////////
function int plotOneSide(string bb$, string gg$, int cc) {
	//type -a In plotOneSide:  bb: %(bb$) gg: %(gg$);
	if(exist(gg$)==3)  //graph existed
		plotm im:=[%(bb$)]1!1 plot:=103 x:=2 y:=3 ogl:=[gg$]1!;
	else
		plotm im:=[%(bb$)]1!1 plot:=103 x:=2 y:=3;   //for lighting, use template with "ogl:=<new template:=EllipsoidLTCyan>" option
	set %(bb$) -b3cc cc;//color
	set %(bb$) -b3m 1;//0:No mesh, 1:Mesh
	return 0;
}
//////////////////////////////////// Plot3DBox /////////////////////////////////////////
function int plot3DBox(ref string gname$, double dX1, double dX2, double dY1, double dY2, double dZ1, double dZ2) {
	type -a 3DBox  X:$(dX1)==>$(dX2), Y:$(dY1)==>$(dY2), Z:$(dZ1)==>$(dZ2);
	int newg = exist(gname$)==3?0:1;
	string enu$, bk$;
	int npts = 5;//square matrix dim
	//// LEFT
	//Create 2D loose datasets of x, y and z for 3D parametric function plot
	create myx -fp2 npts u dX1 dX2 npts dZ1 dZ2;
	create myy -fp2 npts dY1 dX1 dX2 npts dZ1 dZ2;
	create myz -fp2 npts v dX1 dX2 npts dZ1 dZ2;
	//Create matrices for left wall from 2D loose datasets for 3D parametric function plot
	create FuncLeft -mfp myz myx myy "u,v";     //create active matrix
	//create FuncLeft -mfph myz myx myy "u,v";  //create hidden matrix, may need Origin 2017
	//////////////////////////////////////////////////
	enu$ = mid(%H,9)$;  //obtain the enumeration part, %H holds the newly created active matrix window name
	window -ch 1;       //hide matrix window
	//enu$ = mid("%@N",9)$;  //obtain the enumeration part, %@N holds the newly created window name
	///////////////////////////////////////////////////
	//// RIGHT
	//Create 2D loose datasets of x, y and z for 3D parametric function plot
	create myx -fp2 npts u dX2 dX1 npts dZ1 dZ2;     //Outward Right face
	create myy -fp2 npts dY2 dX1 dX2 npts dZ1 dZ2;
	create myz -fp2 npts v dX1 dX2 npts dZ1 dZ2;
	//Create matrices for right wall from 2D loose datasets for 3D parametric function plot
	create FuncRight -mfph myz myx myy "u,v";
	////FRONT
	//Create 2D loose datasets of x, y and z for 3D parametric function plot
	create myx -fp2 npts dX2 dY1 dY2 npts dZ1 dZ2;
	create myy -fp2 npts u dY1 dY2 npts dZ1 dZ2;
	create myz -fp2 npts v dY1 dY2 npts dZ1 dZ2;
	//Create matrices for front wall from 2D loose datasets for 3D parametric function plot
	create FuncFront -mfph myz myx myy "u,v";
	//// BACK
	//Create 2D loose datasets of x, y and z for 3D parametric function plot
	create myx -fp2 npts dX1 dY1 dY2 npts dZ1 dZ2;
	create myy -fp2 npts u dY2 dY1 npts dZ2 dZ1;   //Outward Back face
	create myz -fp2 npts v dY1 dY2 npts dZ1 dZ2;
	//Create matrices for back wall from 2D loose datasets for 3D parametric function plot
	create FuncBack -mfph myz myx myy "u,v";
	//// TOP
	//Create 2D loose datasets of x, y and z for 3D parametric function plot
	create myx -fp2 npts u dX1 dX2 npts dY1 dY2;
	create myy -fp2 npts v dX1 dX2 npts dY1 dY2;
	create myz -fp2 npts dZ2 dX1 dX2 npts dY1 dY2;
	//Create matrices for top wall from 2D loose datasets for 3D parametric function plot
	create FuncTop -mfph myz myx myy "u,v";
	//// BOTTOM
	//Create 2D loose datasets of x, y and z for 3D parametric function plot
	create myx -fp2 npts u dX2 dX1 npts dY1 dY2;   //Outward Bottom face
	create myy -fp2 npts v dX1 dX2 npts dY1 dY2;
	create myz -fp2 npts dZ1 dX1 dX2 npts dY1 dY2;
	//Create matrices for bottom wall from 2D loose datasets for 3D parametric function plot
	create FuncBottom -mfph myz myx myy "u,v";
	//////////////////////////////////////////////////////////
	// Plot
	if(newg==0) {
	  win -o %(gname$) {
		type "> Adding a plot of the Left face to the existing graph %(gname$)";
		plotOneSide("FuncLeft"+enu$, gname$, 5);
	  }
	}
	else {
		plotOneSide("FuncLeft"+enu$, gname$, 5);
		gname$=%H; //hold the created graph window name
		//type "> Creating a new graph %(gname$) by plotting the Left face";
	}
	win -o %(gname$) {
		//type "adding other faces to %(gname$)";
		plotOneSide("FuncRight"+enu$, gname$,5); //plot RIGHT wall in CYAN
		plotOneSide("FuncFront"+enu$, gname$,4);  //plot FRONT wall in BLUE
		plotOneSide("FuncBack"+enu$, gname$, 4);  //plot BACK wall in BLUE
		plotOneSide("FuncTop"+enu$, gname$, 6);  //plot TOP wall in MAGENTA
		plotOneSide("FuncBottom"+enu$, gname$,6);  //plot BOTTOM wall in MAGENTA
	}
	return 0;
}
//////////////////////////////////////////////////
//                    MAIN                       //
//////////////////////////////////////////////////
string str$;
plot3DBox(str, 0, 3, 0, 1.5, 0, 1);    //to perform plot3DBox to create the first 3D box
plotSphere(str, 5, 4, 4, 0.5);         //to perform plotSphere to create a sphere

//due to timing issue, active window may not be our graph, so we need to use win -o
win -o %(str$) {
    x1=0; x2=5; y1=0; y2=5; z1=0; z2=5;  //scale to make the boxes to the edges
    win -a %(str$);  //Put the graph window to front as active
}
plotpClamp
The plotpclamp function is exclusively for plotting data imported using pClamp import. Here we bring in a sample pClamp file and plot without displaying the plot X-Function panel:
fname$=system.path.program$+"Samples\Import and Export\pCLAMP\93311C01.DAT";
imppClamp;
plotpclamp 1:end tag:=1 stimulur:=1 septstim:=0 ctrl:=0 mode:=2;