In Code Builder, the way to run an OGS file is through the LabTalk console. Whereas, to run and or/store LabTalk scripts, Origin provides in total 11 ways. For further information about running LabTalk scripts in Origin, please refer to LT Running Script. The debugging procedure for LabTalk scripts is the same as debugging Origin C code except for two additional features: Execute Current Section and Execute Selected Lines.
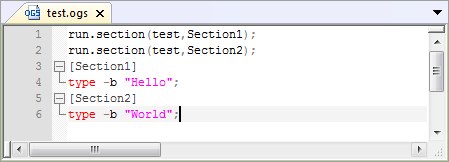
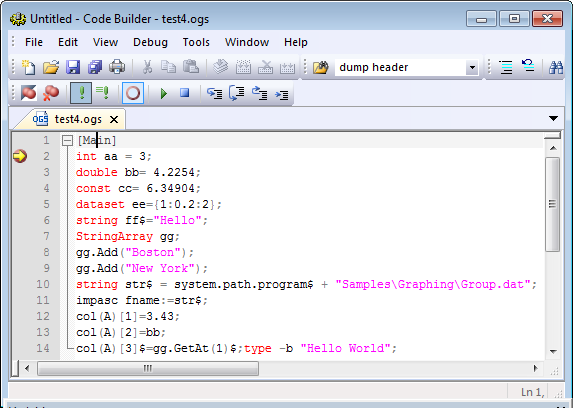
A LabTalk script usually consists of many sections which are declared by placing the desired section name in square brackets [] on its own line.
| Note: If the section declaration did not start from the beginning of the script, the whole part above the first section will be treated as the main section. |
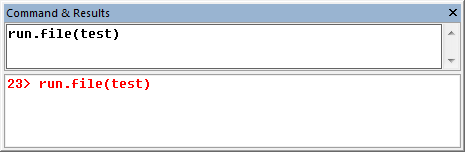
To run an OGS file, select View:LabTalk Console to open LabTalk Console window. Type the following script into that window and press ENTER:
run.file(FileName)
It will execute all lines outside the declared sections, which is by default termed as our main section.
If you want to run a single section in the script, you can use the command below:
run.section(FileName,SectionName)
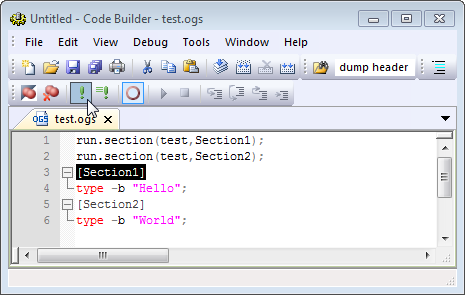
Or you can firstly identify that section as current section by highlighting the section name or by placing the cursor of the Code Builder text editor within the section name. Then click the Execute Current Section button ![]() to run that section.
to run that section.
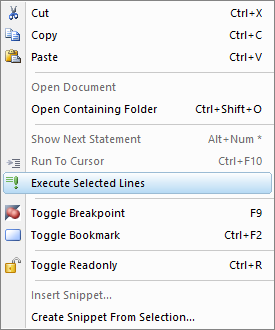
You can right click to run selected lines by context menu Executed Selected Lines
Most Code Builder debugging features of LabTalk scripts work the same as they do for Origin C code, with the condition that the script be saved in a text file of type *.ogs. Breakpoints can be set and cleared in LabTalk scripts and all Origin C code. Debug toolbar buttons work identically. In addition, the Debug toolbar has two buttons that only work for LabTalk script saved in text files of type *.ogs.
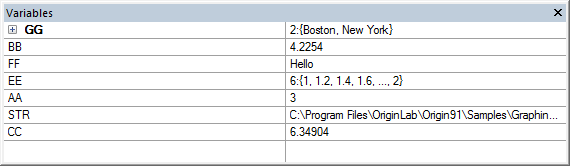
The Code Builder Local Variables window does not display LabTalk variables (LabTalk variables have global scope, not local).
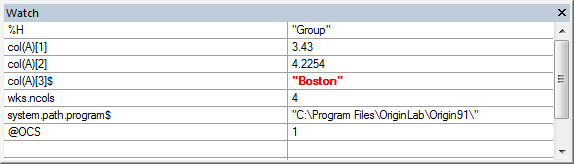
However, the Watch window does display the values of all entered LabTalk variables including numeric, string, and system variables, section/macro arguments (e.g. %1), and even object properties.
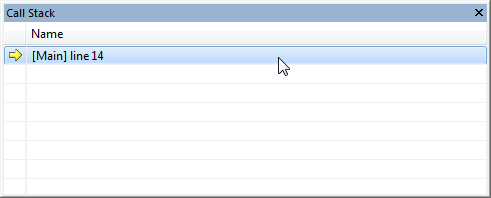
Finally, the Code Builder Call Stack places and displays called script sections on the call stack along with Origin C function calls. The Code Builder Debugger seamlessly steps from sections of LabTalk script into Origin C code and back again.