1.10 Zoomed Inset
Contents
Summary
The Zoomed Inset app can be used to add an inset layer to your graph by interactively zooming into a data plot. A rectangular region of interest tool is provided to decide what data range of the original plot should appear in the inset layer. A connector line can also be added between the ROI and the inset layer.
Note: The tool only works on 2D graphs with Cartesian coordinate system.
Tutorial
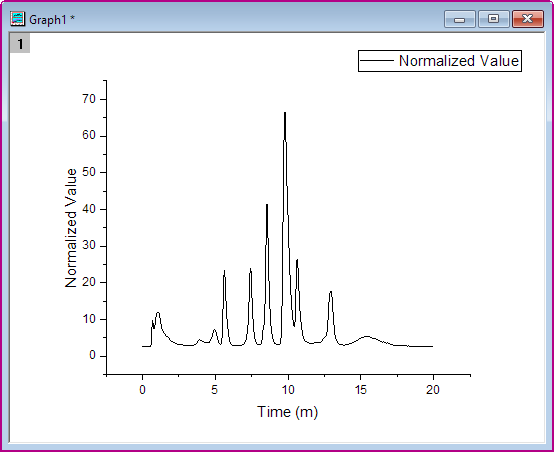
- Import GPC Single Channel Chromatogram 3.dat in the <Origin EXE Folder>\Samples\Spectroscopy\Chromatography\ folder. Select Column B, and then select Plot: Basic 2D: Line menu to make a Line plot.
- When the graph is active, click Zoomed Inset icon
 from the Apps panel of Origin to open the app's dialog box.
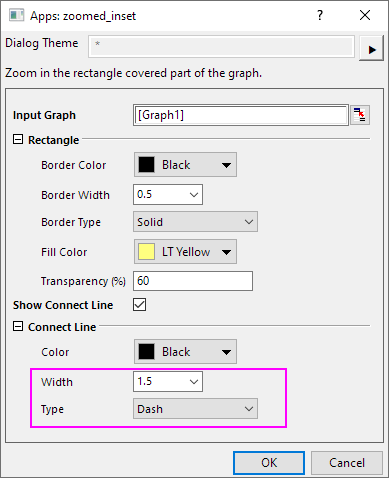
- In the dialog, you can custom the format of the rectangle (the ROI) and the connect line.
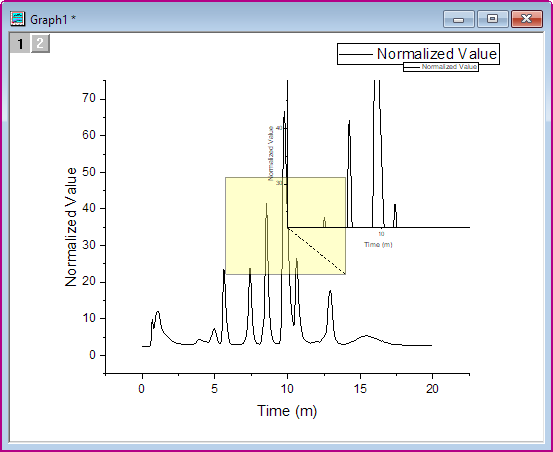
Here, we just change the format of the connect line. Set Width to 1.5 and Type to Dash. - Click OK button. Then the ROI and new layer will show in the graph.
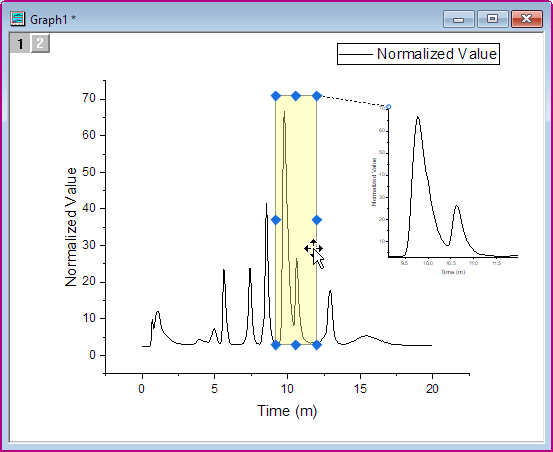
- You can move and/or resize the ROI box to select the part of plot you want displayed in the inset layer. You can also move or resize the inset layer to the desired position within the graph.
- If you want to delete the ROI and the connector line, select them and press Delete key.