1.8 Volcano Plot
Contents
Summary
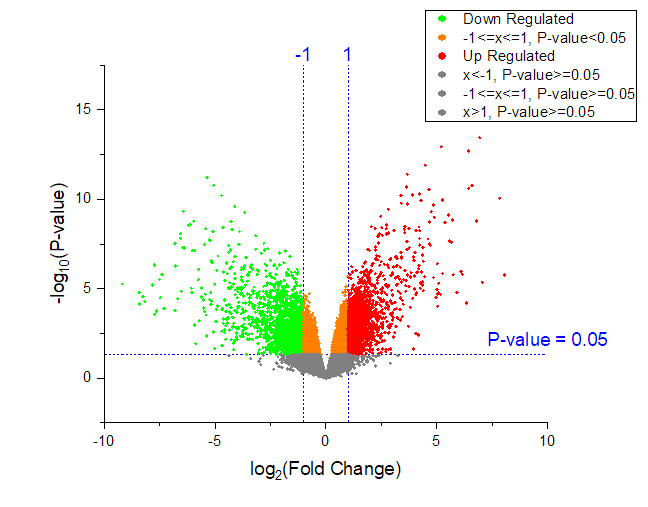
The Volcano Plot app can be used to create scatter plot of p-value versus fold change for microarray data. The graph is composed of six regions. The plot style for each region can be individually customized.
Tutorial
- Download this VolcanoPlotSample.zip file. Open the VolcanoPlotSample.opju in this zip file.
- Highlight Column B and C (XY datasets) in the Boook1 Sheet1, then click the Volcano Plot icon
 in the Apps Gallery window to open the dialog.
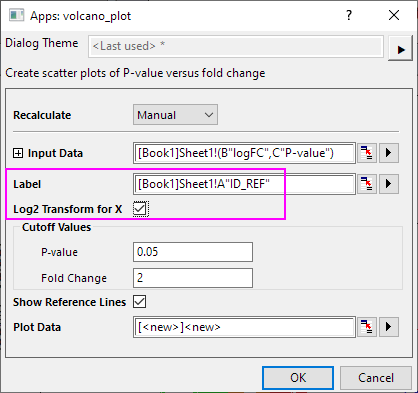
- In the dialog, set column A as Label. X data is linear, so check Log2 Transform for X check box to convert to log 2 scale.
- In Cutoff Values group, set P-value (e.g. 0.05) to divide the graph into upper (significant) and lower parts, and it must be between 0 and 1. Set Fold Change (e.g. 2) to divide the graph into left, middle and right parts, and it must be larger than 1.
- Check Show Reference Lines will add two vertical lines for cutoff values of fold change and a horizontal line for the cutoff P-value in the plot.
- ClickOK. The volcano plot will be created and each region will be shown in different colors.