1.19 Venn Diagram
Summary
The Venn Diagram app is used to show all overlaps among a collection of different group columns, and reveal the possible logic relationships.
Dialog Options
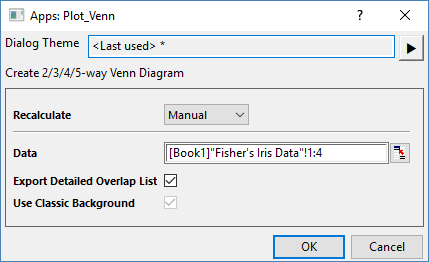
| Data | Supports the number of input Data columns <= 5. |
|---|---|
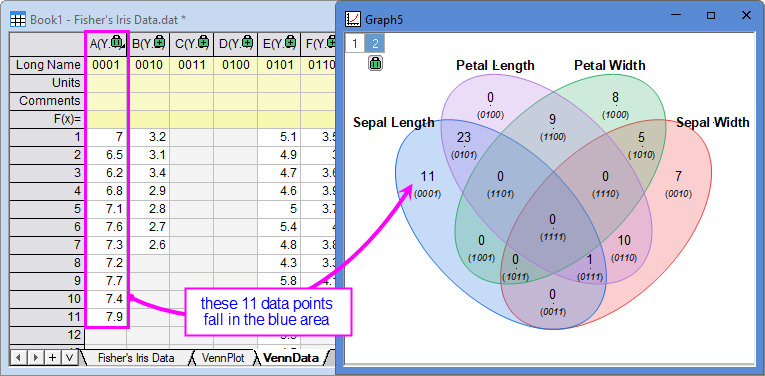
| Export Detaled Overlap List | Select this checkbox to generate a detailed breakdown (“VennData” worksheet) of which data points fall into each unique overlap region and add binary codes (in parentheses) representing region(s) in the Venn diagram. Refer to this section for detailed explanation of the binary codes. |
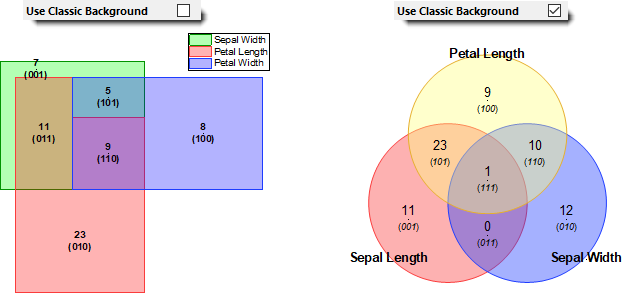
| Use Classic Background | Controls the visual style and shape of the Venn diagram based on the number of input groups.
|
Tutorial
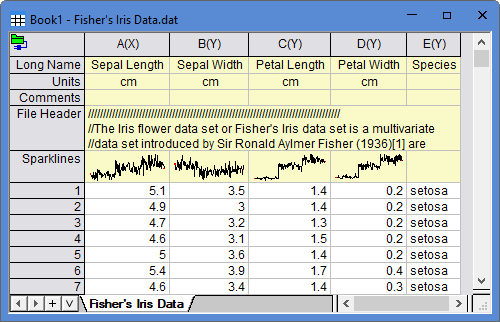
- Create a new worksheet. Import the sample file <Origin Porgram Folder>\Samples\Statistics\Fisher's Iris Data.dat by selelcting Data: Connect to File: Text/CSV menu.
- Highlight Col(A)~Col(D) to click on the Venn Diagram app icon
 to open the dilaog.
- Keep the default settings and click OK button to create the venn diagram.
Results and Interpretation
The source worksheet Fisher's Iris Data collects the four morphological properties (Sepal Length, Sepal Width, Petal Length, Petal Width) of 150 iris flower samples.
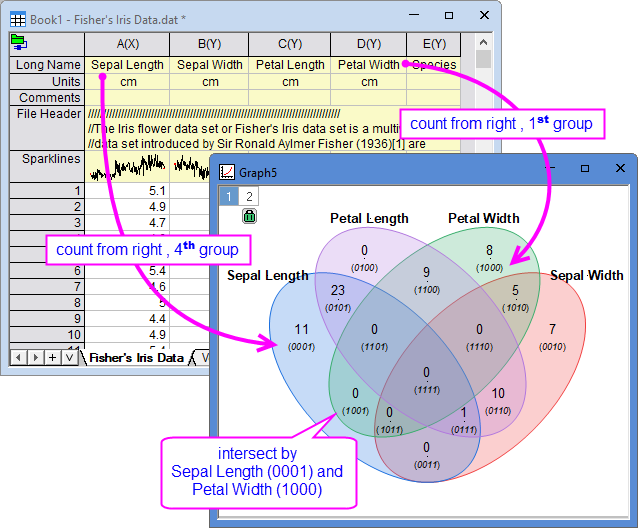
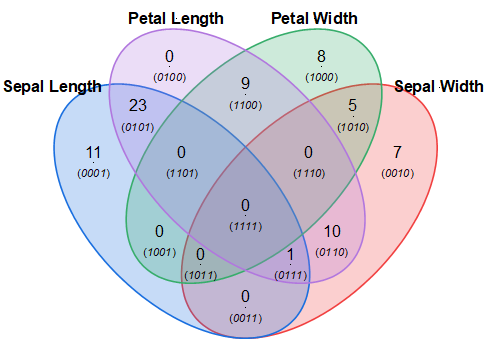
The Venn diagram visualizes the overlap pattern of these properties across the samples, showing how many samples simultaneously satisfy the criteria for multiple properties. Each ellipsoid represents a property (group). The label shows the property name, the number inside shows the count of samples in that region, and the binary code in parentheses (if Export Detaled Overlap List is checked) identifies which properties the region belongs to.
- The binary codes (e.g., 0001, 0100, 1100) indicate which group or intersected groups a region belongs to. The code is read from right to left, where each bit corresponds to a data column from left to right in the source worksheet. For example,
- 0001: the region only belongs to "Sepal Length" group;
- 0011: the intersection region of group "Sepal Length" and "Sepal Width";
- 0111: the intersection region of group "Sepal Length", "Sepal Width" and "Petal Length";
- 1111: the intersection region of all four groups.
- The counting number displayed in each region indicates how many data points fall within that specific overlap. For example,
- The region labeled 11 with code (0001) contains 11 data points that belong only to the "Sepal Length" group;
- The region labeled 1 with code (0111) contains 1 data point that belongs to "Sepal Length", "Sepal Width", and "Petal Length" simultaneously, but not "Petal Width".
- The region labeled 0 with code (0011) contains no data points satisfying the conditions for intersection of "Sepal Length" and "Sepal Width", but keeping intentionally the empty intersection.