2.5.6.1 Tutorial for Warranty Analysis
In this example, a factory is planning to produce 1000 units per month, and needs to decide how many spare-parts should be prepared. Engineers collect 12 months of post-sale claim data, fit a Weibull distribution to the observed failures, and use the model to forecast expected failures - and thus spare-part demand - over the future 5 months.
Topics for Warranty Analysis: |
Sample Data
Right click on the Reliability and Survival app icon ![]() in the Apps Gallery and choose Show Samples Folder. Double-click to open the sample project RSASample.opju. Go to sub-folder 3. 'Warranty Analysis.
in the Apps Gallery and choose Show Samples Folder. Double-click to open the sample project RSASample.opju. Go to sub-folder 3. 'Warranty Analysis.
Origin’s Warranty Analysis requires the input data arranged in "interval-censor" format, such as the one shown in [Book1]Sheet1:
- Start time: beginning of the interval (months, weeks, seasons, etc.),
- End time: end of the interval (same unit as Start time),
- Frequencies: count of failures in the interval.
For right-censored units (the last 12 entries in this example), the End time is missing.
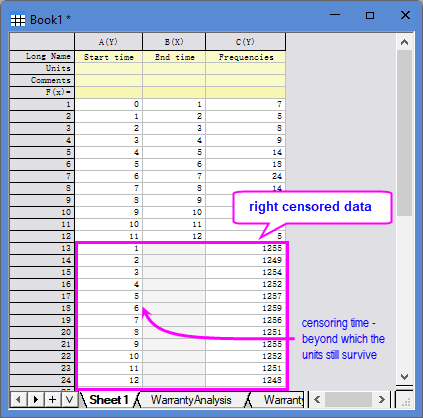
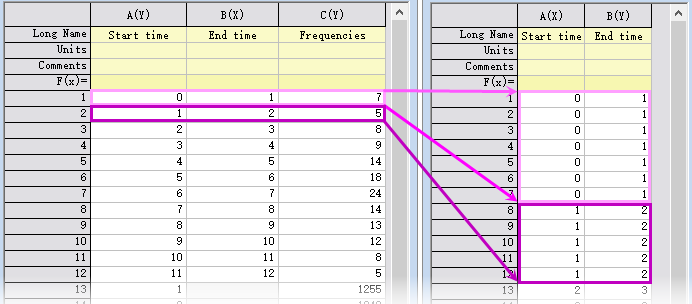
The "Frequencies" column is optional. If omitted, you can duplicate the interval and each duplicate represents one failure.
Steps
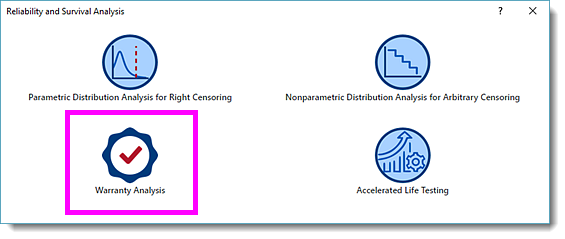
- With [Book1]Sheet1 active, click the Reliability and Survival app icon
 in the App Gallery . In the opened panel, choose Warranty Analysis.
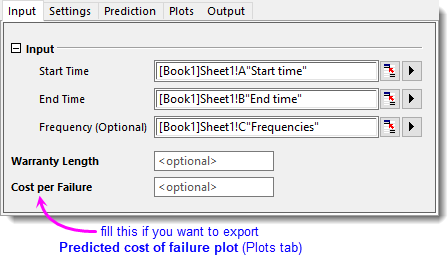
- In the WarrantyAnalysis dialog, specify the settings as follow:
- On Input tab, select column A for Start Time, column B for End Time, and column C for Frequency, respectively.
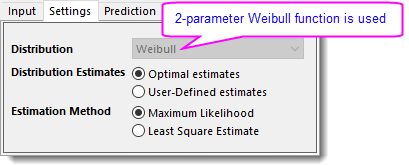
- On Settings tab, Estimation Method uses Maximum Likelihood by default.
-
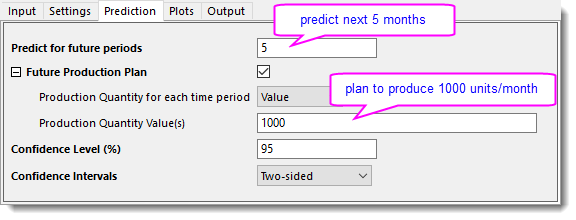
- On Prediction tab, set Predict for future periods to 5. Select Value for Production Quantity for each time period and enter 1000 for Production Quantity Value(s). Note that if monthly production quantity varies, enter the quantities separated by space, or select Column for Production Quantity for each time period and specify the quantity column.
-
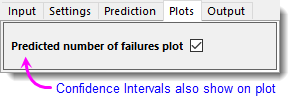
- On Plots tab, make sure Predict number of failures plot is checked.
-
- On Input tab, select column A for Start Time, column B for End Time, and column C for Frequency, respectively.
- Click OK button to generate report sheets.
Results and Interpretation
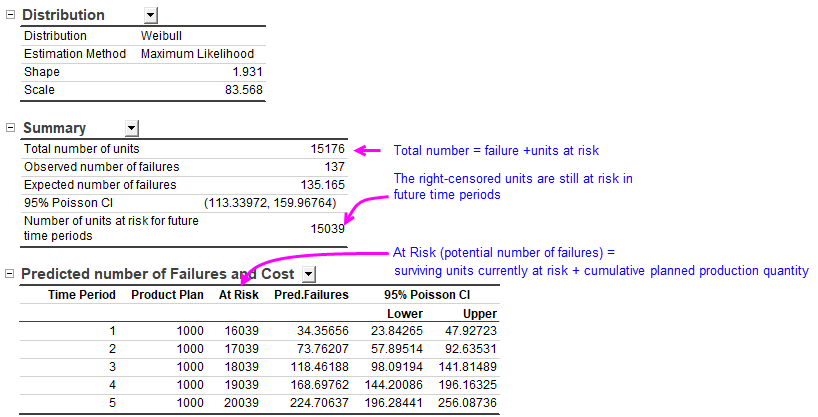
- The Distribution table reports the two Weibull parameters, “Shape” and “Scale” estimated by the Maximum likelihood method. All subsequent calculations and forecasts derive from this model.
- The Summary table provides an overview of the post-sale claim data. The “Observed number of failures” lies in the “95% Poisson Confidence Interval” of the “Expected number of failures”, indicating that the observation and expectation are not significant different. This result also confirms that the Weibull model adequately describes the current data.
- The Predicted number of Failures and Cost table gives the future 5-month forecast. The predicted number of failures is 225, within a 95% CI of 196 – 256. This also confirms in the Prediction Plot. Managers can use this prediction to set aside reserves and schedule spare-part orders.