2.42.2.2.3.2 Tutorial of Response Surface Design
 
|
 
|
Create Design
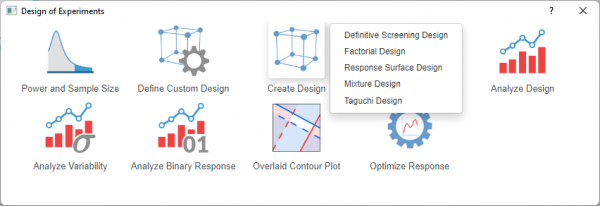
- Click the Design of Experiments icon
 in the Apps Gallery
 - Click the Create Design button and select Response Surface Design.
-
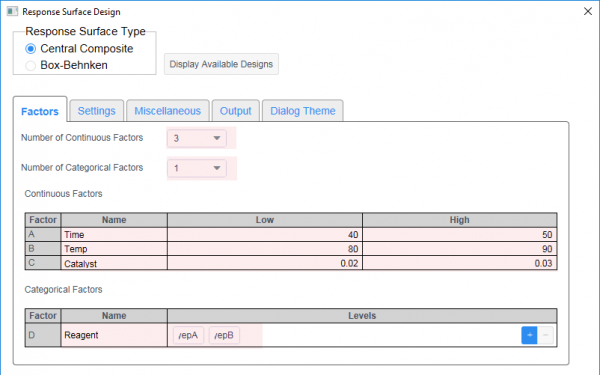
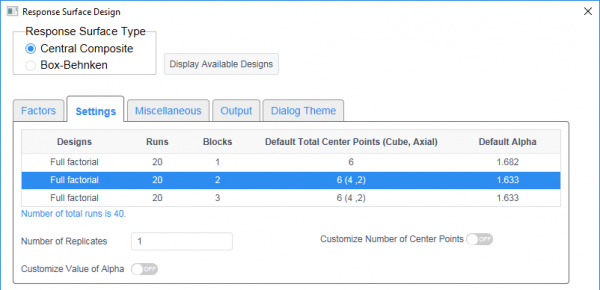
- Choose Central Composite. In the Factors tab, select 3 from Number of Continuous Factors drop-down list. Enter factor names (Time, Temp and Catalyst). Then enter low and high values (40-50, 80-90, and 0.02-0.03 respectively). Select 1 from the Number of Categorical Factors drop-down list. Enter Reagent in factor name. Then Enter level values (TypeA, TypeB).
-
- In the the Settings tab, select second design(Blocks=2).
- In the the Miscellaneous tab, turn off the Randomize Design button.
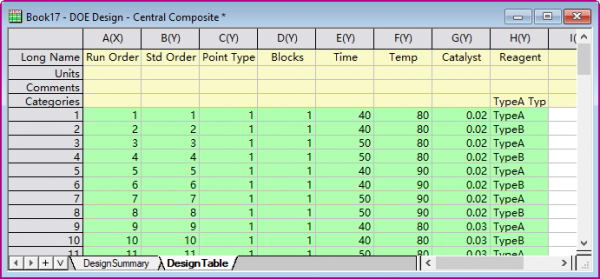
- Click OK to output the design table.
Analyze Design
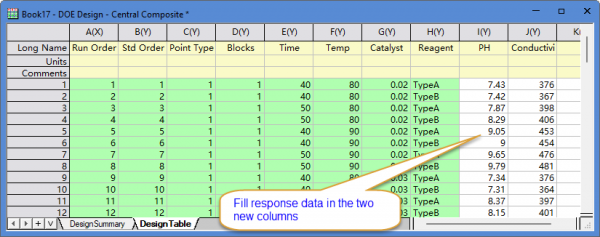
- Add two new columns on the design table and fill in response data. Use PH and Conductivity as Long Name.
- Click the Design of Experiments icon in the Apps Gallery
- Activate the design table and click Analyze Design button

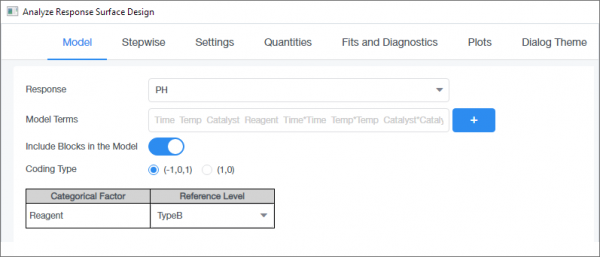
- In the the Model tab, select PH for Response. Then select Linear + Squares from Model Type drop-down list. Turn on Include Blocks in the Model button.
- In the Quantities tab, select Coefficients, Standard Error, Confidence Limits, t-Value and Prob>|t| from Coefficients Table drop-down list
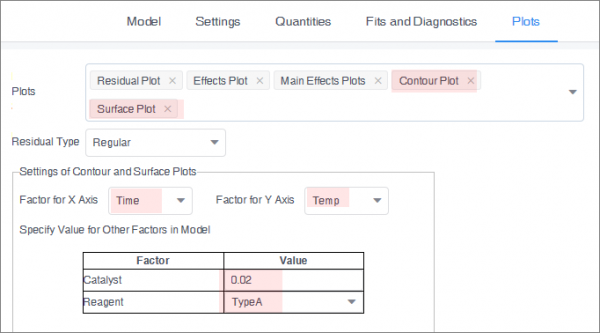
- In the Plots tab, select Contour Plot, Surface Plot. In the Settings of Contour and Surface Plots group, select Time and Temp as factors for X and Y axis. In the row for Catalyst, under Value, enter 0.02. In the row for Reagent, under Value, select TypeA.
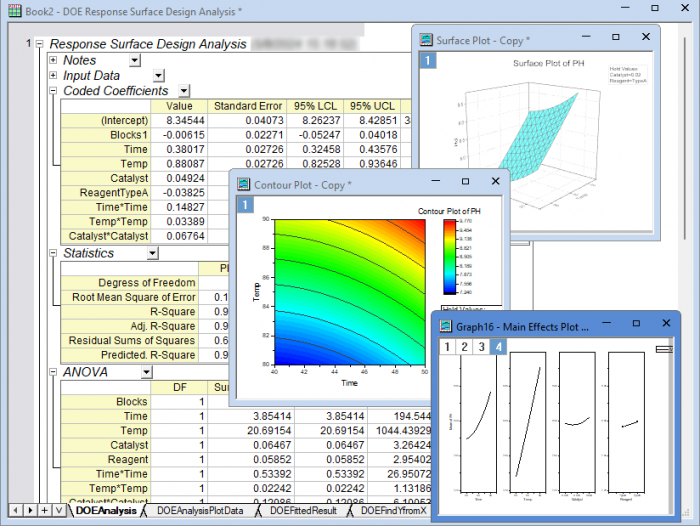
- Click OK to create analysis results.
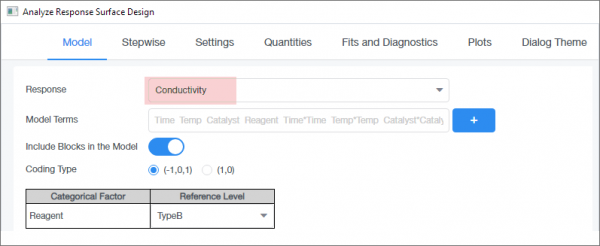
- Click Analyze Design button again, and then select Conductivity for Response in the the Model tab.
- Other setting follow the above step5 and step6. Click OK to create analysis results.
Optimize Response
- Click the Design of Experiments icon in the Apps Gallery
- Activate the analysis workbook we got in last section and click Optimize Response button

- In the Goal tab, in the table, for PH, select Maximize as Goal and set 5 as Lower Limit and 9 as Upper Limit. For Conductivity, select Minimize as Goral. 350 as Lower Limit, and 550 as Under Upper Limit.
-

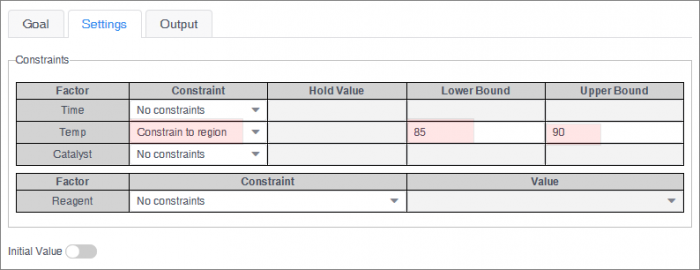
- In the Settings tab. for Temp, select Constrain to Region as Constrain. Enter 85 and 90 as Lower Bound and Upper Bound.
-
-
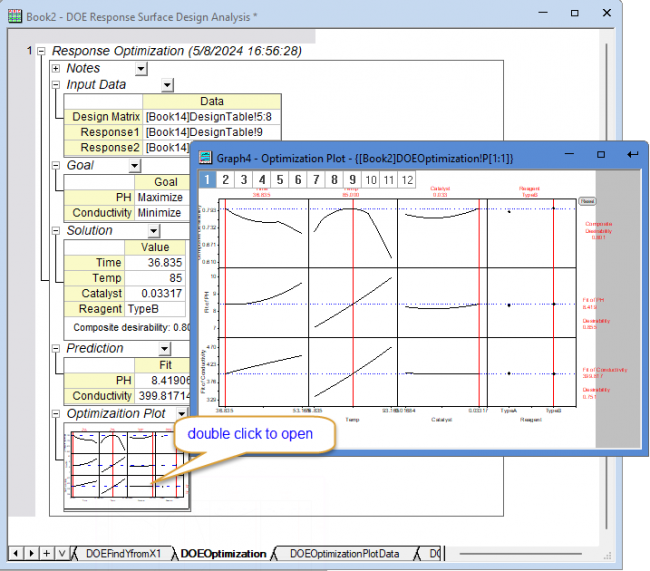
- Click OK to generate optimization report.
-
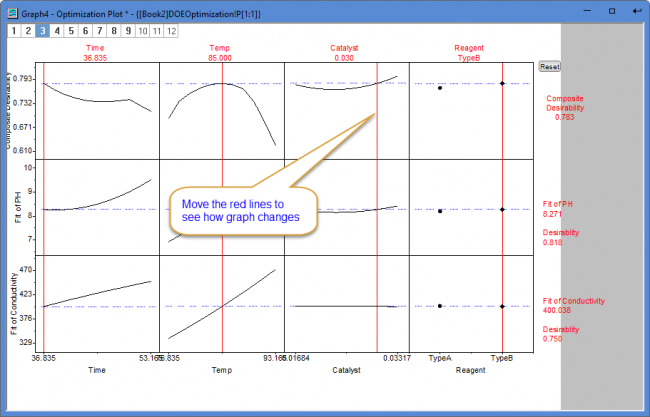
- Double-click Optimization Plot to bring up the graph window. Move vertical red lines to change factor values to view how they affect the composite desirability and the responses. Click Reset button to set values to optimal solution.