2.76.1.1 Tutorial for Identify Data Distribution
Contents
Notes for Starting
- Download the sample project file from here and open it in Origin.
- Start this tutorial with the app Statistical Process Control installed. If you have not installed the app, see Apps for Origin to find and install the app.
Topics for Further Reading: |
User Story
A house builder has house sold data in the surrounding area. He want to find out a best fit distribution of the data for follow-up analysis.
Identify Data Distribution
- Open the sample project file in Origin, go to Folder 3. Nonnormal using the Project Explorer. Activate the workbook House Sold
- Highlight column B in worksheet. Click the Statistical Process Control icon
 in the Apps Gallery window.
 - Choose Identify Data Distribution tab, click Identify Data Distribution icon to open the dialog
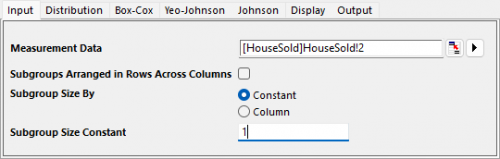
- In the Input tab of the opened dialog, column B will be selected automatically as Measurement Data. Choose Subgroup Size By to be Constant and set the Subgroup Size Constant to be 1
-
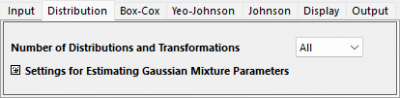
- In the Input tab, keep Number of Distributions and Transformations to be All.
-
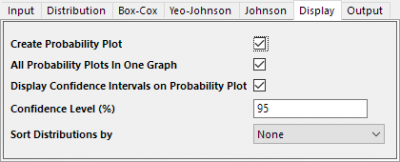
- In the Display tab, check the Create Probability Plot
- Click OK button. The report sheet will be created
Interpreting the Results
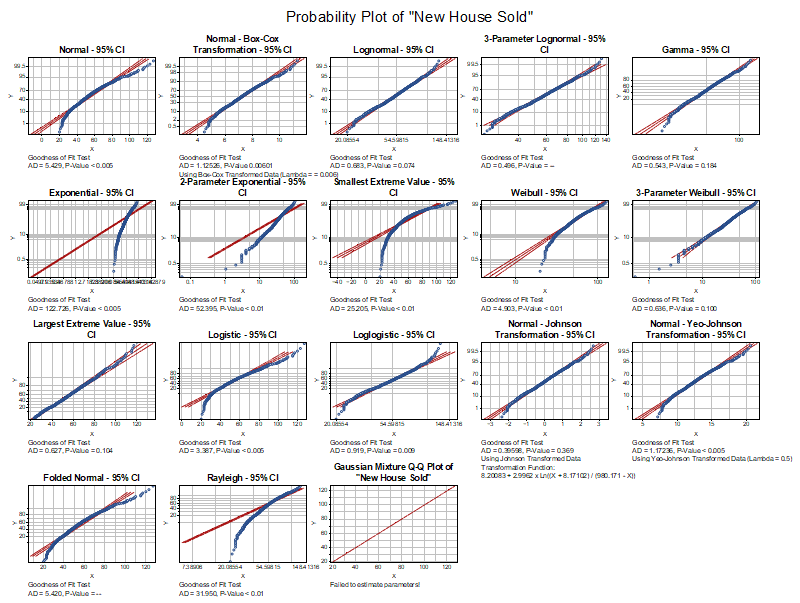
We can compare and select a fitting model based on the following results
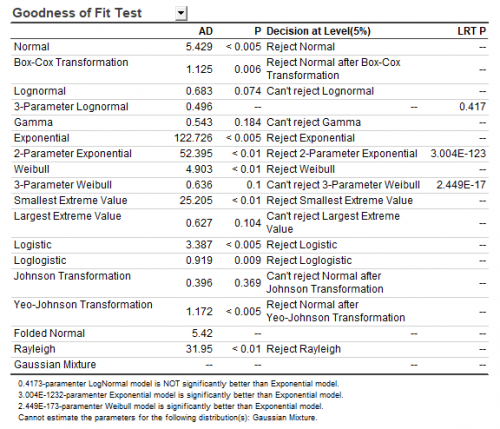
Following distributions are good fit for the data. Their P value are larger than 0.05 in the Goodness of Fit Test table. And the points on the probability plot follow a straight line within the confidence bounds.
- Johnson Transformation (0.369)
- Gamma (0.184)
- Largest Extreme Value (0.104)
- 3-Parameter Weibull (0.1)
- Lognormal (0.074)
Probability (P-P) Plot
The closer all the scatter points are to the reference line, the better the distribution is for the dataset.
Goodness of Fit Test table