2.42.2.2.2.2 Tutorial of Factorial Design
 
|
 
|
Create Design
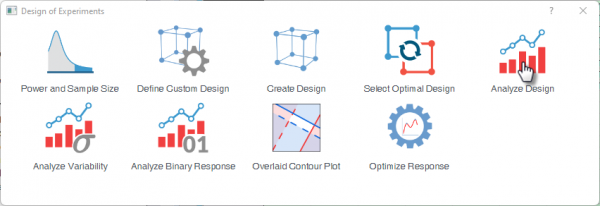
- Click the Design of Experiments icon
 in the Apps Gallery
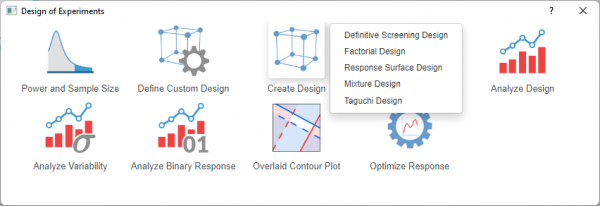
 - Click Create Design button and select Factorial Design.
-
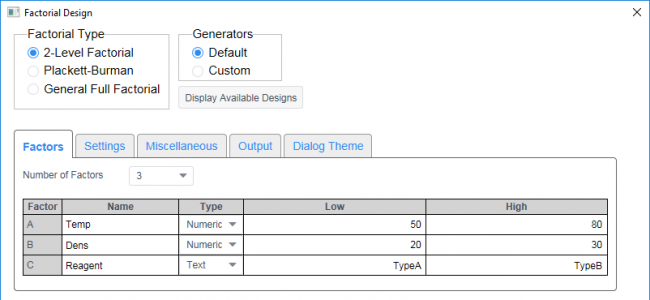
- Make sure 2-Level Factorial and Default Generators is selected. In Factors tab, select 3 from Number of Factors. Enter factor names Temp, Dens and Reagent and select factor types (Numeric, Numeric and Text). Then Enter low and high values (Temp:50, 80; Dens:20, 30; Reagent: TypeA, TypeB).
-
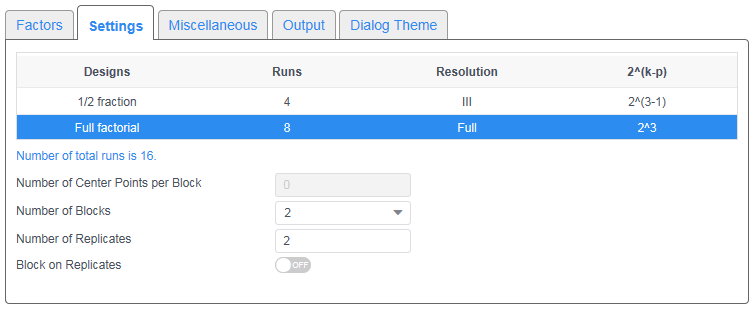
- In the Settings' tab, select Full factorial design. Enter 2 in Number of Replicates. Select 2 from Number of Blocks drop-down list.
- In the Miscellaneous Tab, enter 5 in Seed for Randomization text box.
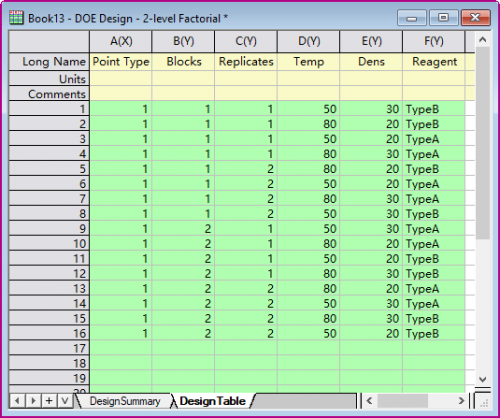
- Click OK to output the design table.
Analyze Design
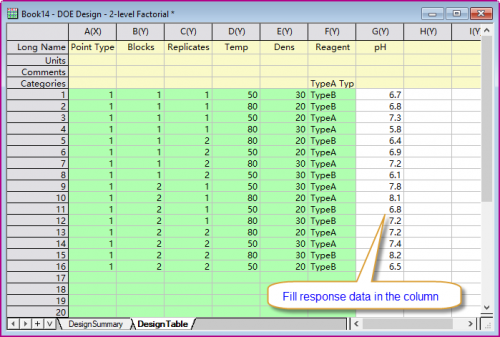
- Add a new column on the design table and fill in response data. Use pH as Long Name
- Click the Design of Experiments icon to bring up toolbar. Select Analyze Design
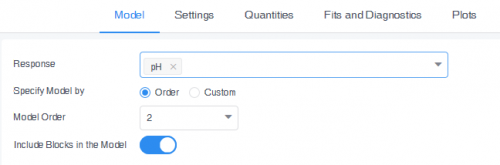
- In the Model tab, select PH from Response drop-down list. Then select 2 from Model Order. Select Include Blocks in the Model.
- In the Settings tab, select Main Effects from the Means Table drop-down list.
- In the Quantities tab, select Coefficients, Standard Error, Confidence Limits, t-Value and Prob>|t| from the Coefficients Table drop-down list.
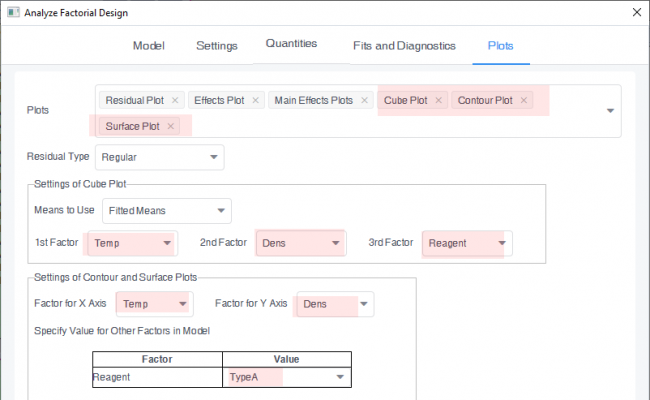
- In the Plots tab, select Cube Plot, Contour Plot, Surface Plot and 2-way interaction plot. In the Settings of Cube Plot group, choose Temp, Dens and Reagent as three factors. In the Settings for Contour and Surface Plot group, select Temp and Dens as factors for X and Y axis. Then select TypeA as value of Reagent.
-
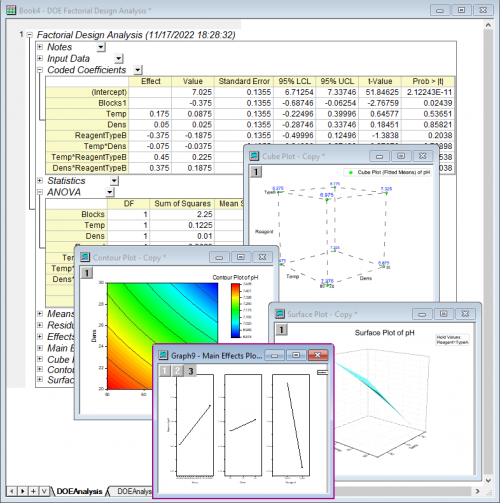
- Click OK to create analysis results.
Optimize Response
- Click the Design of Experiments icon in the Apps Gallery
- Activate the analysis workbook we got in last section and click Optimize Response button

- In the Goal tab, select Minimize as goal for PH. Enter 5 and 9 in Lower Limit and Upper Limit.
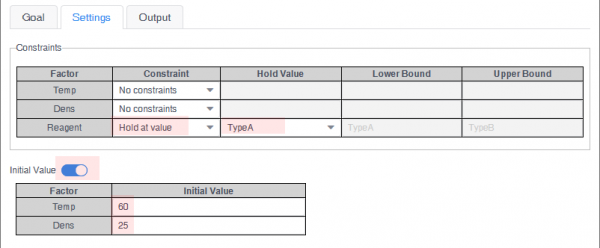
- Go to the Settings tab. In the row for factor Reagent, select Hold at Value for Constraint, select TypeA for Hold Value. Enable Initial Value button. Enter 60 and 25 in the rows for Temp and Dens respectively.
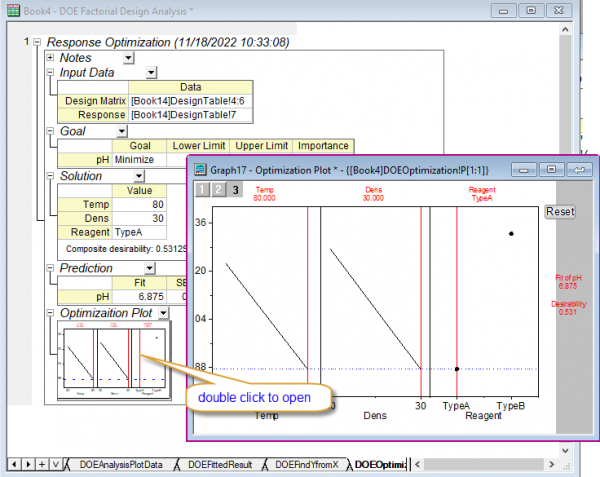
- Click OK to generate optimization report.
-
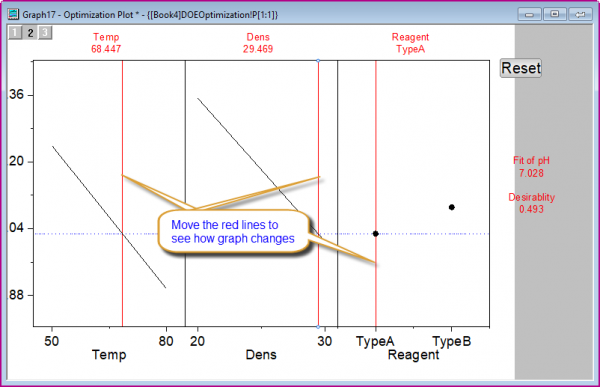
- Double-click Optimization Plot to bring up the graph window. Move vertical red lines to change factor values to view how they affect the composite desirability and the responses. Click the Reset button to set values to optimal solution.