【お知らせ】この部分は英語原文のみでの提供となります。何卒ご了承ください。
2.75.5.1 Tutorial for Data Transformation
Notes for Starting
- Download the sample project file from here and open it in Origin.
- Start this tutorial with the app Statistical Process Control installed. If you have not installed the app, see Apps for Origin to find and install the app.
 | Topics for Further Reading: |
User Story
A Site Reliability Engineer (SRE) is analyzing cloud infrastructure performance. He wants raw, heavily right-skewed latency metrics (API_Latency) transformed into a Gaussian distribution. So that our statistical quality control models and automated alert thresholds can reliably detect true latency spikes without producing high false-positive rates caused by skewed raw data
Steps in Origin
- Open the sample project file in Origin, go to Folder 3. Nonnormal using the Project Explorer. Activate the workbook API Response Time
- Highlight column B in worksheet. Click the Statistical Process Control icon
 in the Apps Gallery window.
 - Choose Data Transformation tab, all the data are larger than 0. From the decision tree, we should use Box-Cox method. Click Box-Cox Transform icon to open the dialog
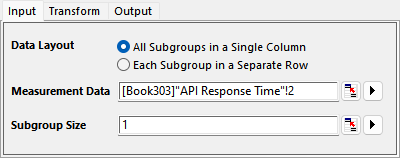
- In the Input tab of the opened dialog, column B will be selected automatically as Measurement Data. Set the Subgroup Size to be 1
-
- Accept all other default settings and click OK button
Interpreting the Results
- Double click on the embedded graph on report sheet
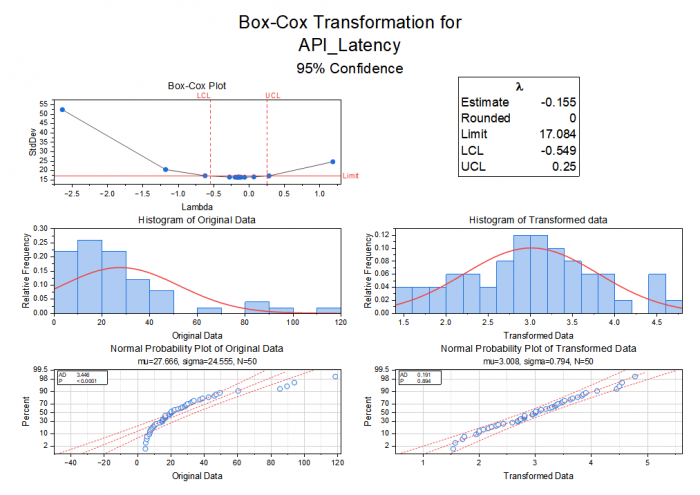
- \(\lambda=0\) lies well within the 95% confidence interval [-0.549, 0.25]. It means a transformation is appropriate.
- From the histogram and probability plot of transformed data, we can see the data are approximately normal after the transformation.
- The transformed data follows a normal distribution (\(p = 0.894 > 0.05\)), making it suitable for parametric statistical analysis (e.g., ANOVA, hypothesis testing, or capability analysis).