2.5.10.1 Tutorial for Demonstration Test Plan
The Demonstration Test Plan is a pre-test design tool for reliability validation. It translates a reliability target, a confidence level, and engineering assumptions into an actionable sampling rule:
"test this many units for this long, allow this many failures, and if the result passes, you may claim the target is met at the stated confidence."
 | Topics for Demonstration: |
In this example, an electric vehicle factory enhanced the lifetime of their high-voltage battery, for which failure is defined as the battery capacity dropping below 80%. Before mass production, engineers need to design a substantiantion test aiming at demonstrating that the improved battery pack Gen-2 is at least as durable as the original pack Gen-1.
Engineers collected the neccessary historical data from Gen-1:
- battery lifetime follows a Weibull distribution.
- Shape parameter = 2.8 (> 1, a wear-out failure mode).
- Scale parameter = 2400 equivalent full charge-discharge cycles (characteristic life), i.e., ~63.2% of batteries lose more than 20% capacity before 2400 cycles.
Engineers sample 15 battery packs from the prototypes of Gen-2 and use Demonstration to create a test plan to demonstrate that the characteristic life of Gen-2 is no less than that of Gen-1.
Steps
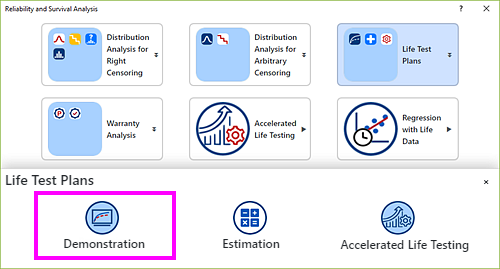
- Select menu Statistics: Survival Analysis: Reliability and Survival Analysis. In the opened panel, click Life Test Plans block and then choose Demonstration icon.
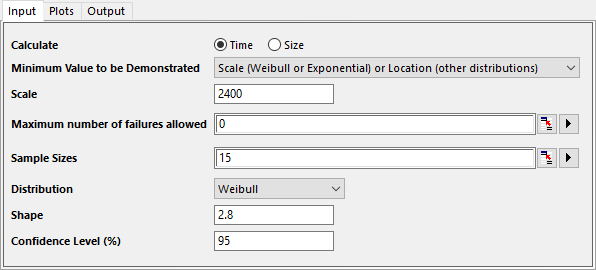
- In the dialog that opens, specify the settings on the Input tab as follows:
Calculate Determines which quantity to be calculated: the test duration per unit or the sample size. Minimum Value to be Demonstrated Specify the reliability target. Choose the statement that matches your spectification. - Scale (Weibull or Exponential) or Location (other distributions):
Demonstrate that the distribution's Scale parameter (characteristic life) for Weibull or exponential distribution or Location parameter for normal, lognormal, logistic, etc. distributions is at least the specified Scale or Location value. - Percentile and Percent:
Demonstrate that no more than the Percent of units have failed by the Percentile time. - Reliability and Time:
Demonstrate that at least the Reliability (survival probability) of units still run at the Time. It is mathematically equivalent to the Percentile and Percent option but may match your specification language better. - MTTF (mean time to fail):
Demonstrate that the MTTF is at least the entered value. It is usually used in an Exponential distribution, where MTTF equals the scale parameter and is the natural metric.
Maximum Number of Failures Allowed Specify the largest number of failures that still allows the test to be declared a pass. Entering 0 sets the strictest rule: any observed failure causes the demonstration to fail. It requires the smallest sample size or test time but provides no failure-time data for verifying the assumed distribution.
Entering 1, 2, ... sets a more tolerant rule. They allow some failure-time data but increase the required sample size or test time.Note: You may enter multiple values separated by spaces or a column of values to compare how relaxing the acceptance rule affects the plan.
Sample Sizes / Testing Times Specify the sample sizes when Calculate = Time, or test durations for each unit if Calculate = Size. Increasing sample size shortens the required test time per unit, and vice versa. Note: You may enter multiple values separated by spaces or a column of values to compare sample size against test duration.
Distribution Select the probability distribution and the assumed Scale/Shape parameter value used to model failure times. The test plan can be sensitive to the specified Shape (Weibull) or Scale (other distributions) so it is good to enter a range of plausible values and compare the results.
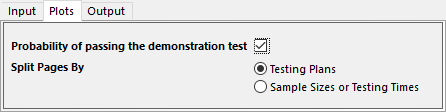
- On the Plots tab, leave the default settings unchanged. Refer to the "Results and Interpretation" section for the explanation of Probability of passing the demonstration test.
- Click OK button to generate report.
Results and Interpretation
Test Plans
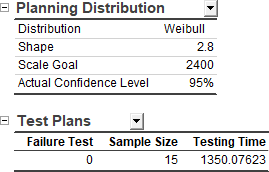
- Take 15 Gen-2 battery packs and test each one to 1351 equivalent full cycles.
- If 0 packs fail before 1351 cycles: the demonstration passes. You may claim, with 95% confidence, that "Gen-2 meets or exceeds the Gen-1 characteristic life of 2400 cycles".
- If 1 or more packs fail before 1351 cycles: the demonstration does not pass. You cannot make the 95% confidence claim using this plan. This does NOT prove Gen-2 is worse; it only means the evidence is insufficient under the chosen test plan (sample size, test time, and maximum number of failures allowed).
Likelihood of Passing Plot
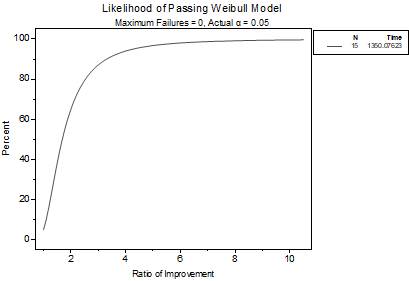
- The plot shows how likely this plan is to pass if the true Gen-2 characteristic life is k times the Gen-1 baseline. Therefore, it helps to judge whether the chosen plan is practical: if even a substantially better-than-target product has only a modest chance of passing, you may wish to increase the maximum number of failures allowed.
- k = 1.0: If the true Gen-2 characteristic lifetime is exactly 2400 cycles, the plan has only a 5% chance of passing — the specified consumer's risk.
- k = 2.0: If the true Gen-2 characteristic lifetime is twice as Gen-1, the plan has a ~65% chance of passing - roughly one in three such tests would fail despite the product being truly better.
If the true improvement is about twice as durable and the team cannot accept a ~35% chance of failing the demonstration, allowing failures, e.g., Maximum number of failures allowed = 1 or 2, must be considered. Note that allowing one more failure typically lengthens the per-unit test time. - k ≥ 4.0: The plan is very likely (>94%) to pass.
Conclusion
- Run 15 Gen-2 battery packs to 1351 equivalent full cycles, if zero failures you can claim 95% confidence that the characteristic life is larger than 2400 cycles.
- Note that a test of 1351 cycles on a single battery pack would take years to complete. Accelerated aging methods, such as elevated temperature or higher charge-discharge rates, are typically used to compress the testing period into just a few months.