1.34 Taylor Diagram
Summary
The Taylor Diagram app can be used to create taylor diagram for facilitating the comparative assessment of different models.
Tutorial
Creating a Tailor Diagram
- Download the TailorDiagramSample.zip file.
- Drag and drop the PolarXrYTheta.otpu to Origin to install the user-defined template.
- Open the Tailor Data.opju in Origin
- Click the Tailor Diagram icon,
 , from Apps Gallery.
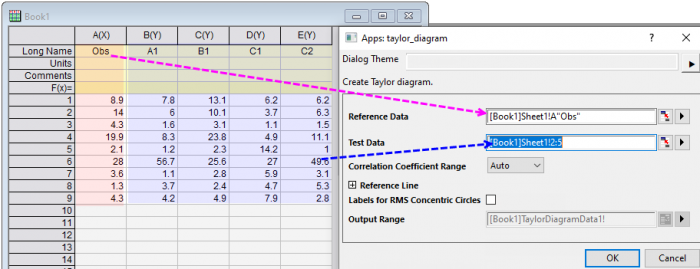
 - In the opened dialog, set column A to be Reference Data, set column B ~ E to be Test Data. Click OK to create the graph
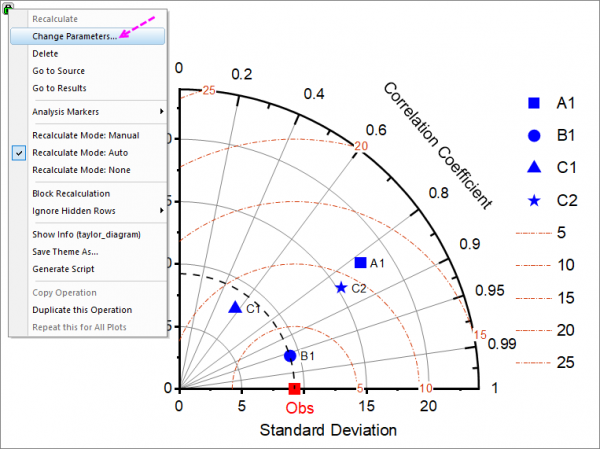
- Click on the green lock on the generated graph and choose Change Parameter from context menu
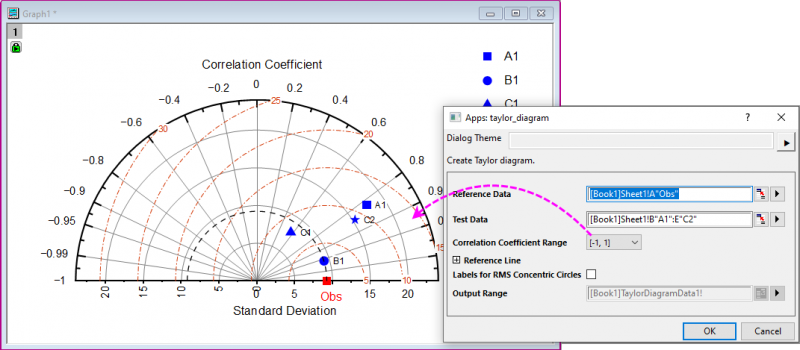
- In the opened dialog, change Correlation Coefficient Range to be [-1, 1]. We will get a Taylor Diagram with half circle.
The Skills to Customize the Tailor Diagram
To show all the labels outside layer
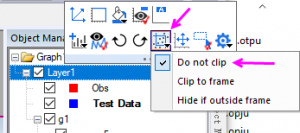
- In the Object Manager, click Layer1 to bring up mini toolbar of Layer, click Clip Data to Frame button and choose Do not Clip
-
To change the symbol of the scatters basing on models
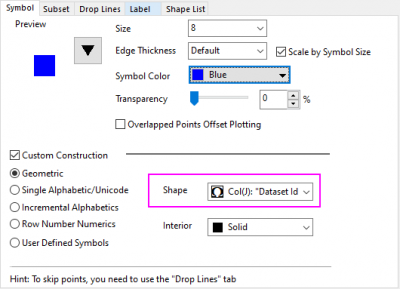
- Double click on the scatters to open the Plot Details dialog, in the Symbol tab, set Shape to be Col(J).
- Notes: The symbols can be further changed in the Shape List tab of Plot Details dialog
To change the color of the scatters basing on models
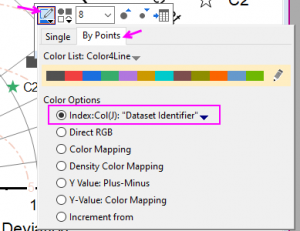
- Click on the scatter to bring up the mini toolbar for data points, click the Symbol Edge Color button, select By Points tab and set color to be Index to Col(J)
- Note Each symbol color can be further customized by clicking the Pencil button in the same dialog below
To change the color or width of the reference lines
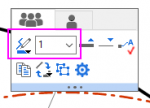
- Click on the reference lines and change it in the mini toolbar
To add label for the reference lines
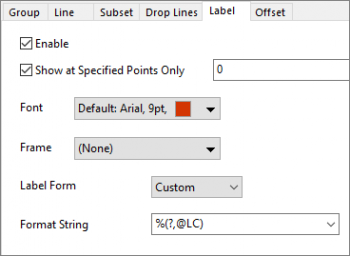
- Double click on the reference lines to bring up Plot Details dialog, in the Label tab, set settings as below
- Show at Specified Points Only = 0
- Label Form = Custom
- Format String = %(?,@LC)