2.59 Standard Curve Analysis(Pro)
Contents
Summary
This Standard Curve Analysis app can be used to fit a standard curve like Concentration vs Absorbance. Such a curve can be used to determine concentrations in "unknown" samples with their measured absorbance. This method is commonly used to analyze RIA or ELISA Data.
Tutorial
Step 1: Create new worksheet to input data
- Click the Standard Curve Analysis icon from Apps Gallery to open a Standard Curve Analysis toolbar.
- Click first button
 to open the dialog.
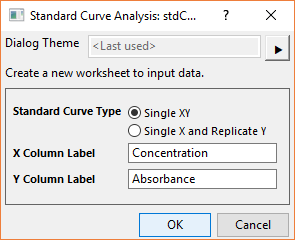
- Since we only have single XY dataset in this example, select Single XY as Standard Curve Type. Fill
ConcentrationandAbsorbancefor X and Y Column Label, respectively. - Click OK to create a new worksheet. The new sheet is divided into 2 blocks distinguished by different colors.
- Enter following standard curve data in the 1st block.
Sample Name Concentration Absorbance S1 1.2 0.363 S2 1.4 0.41 S3 1.6 0.475 S4 1.8 0.496 S5 2 0.527 S6 2.2 0.54 S7 2.4 0.571 S8 2.6 0.592 S9 2.8 0.599 S10 3 0.608 Enter following unknown sample data in the 2nd block.
Sample Name Absorbance A1 0.379 A2 0.422 A3 0.511 A4 0.587

Step 2: Perform standard curve analysis
- Activate the worksheet created in previous section and click 2nd button
 to open the dialog.
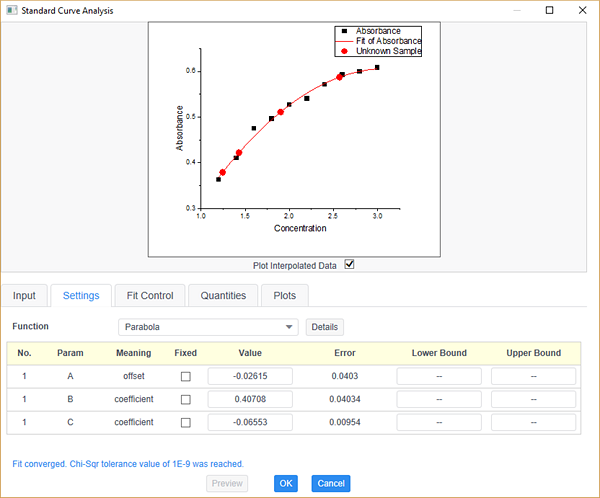
- In the Input tab, you will find that the standard curve data and unknown sample data are selected as Standard Curve Data and Data to interpolate automatically.
- In the Settings tab, let’s select Parabola from Function drop-down list to fit the data. Click Preview button to see the fitting results.
- Optionally, you can select the desired quantities-on-Quantities tab and plots to output on Plots tab.
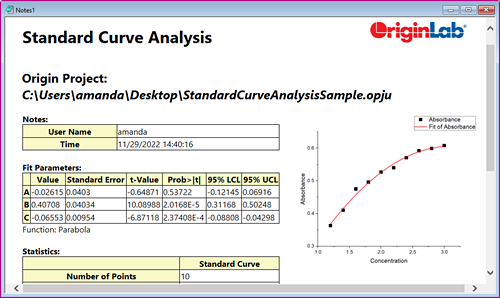
- The fitting looks good so we click OK button to create the report.
Step3: Create an HTML report
- Activate the report sheet [Book1]StandardCurveAnl and click 3rd button
 .
.
An HTML report will be created.