2.35 Spectral Broadening
Summary
Spectral Broadening app is used to broaden spectra, or to simply smooth any data by applying a filter function. The filter function can be Gaussian or Lorentzian. Applying a filter function can be particularly useful to broaden spikes in a spectrum.
NOTE: This App requires OriginPro.
Tutorial
- Create a new workbook by clicking the New WorkBook button
 on the Standard toolbar. Select menu Data: Connect to File. Import file <Origin Program Folder>\Samples\Spectroscopy\Sample Pulses.dat with default settings.
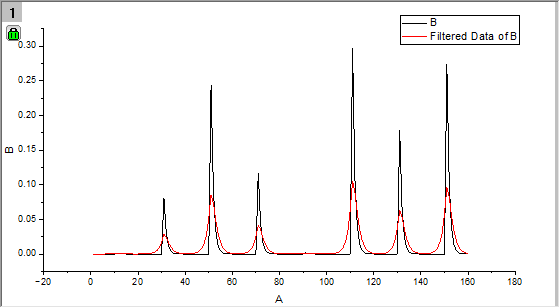
- Highlight col(B) and select menu Plot > Basic 2D : Line to plot the spectrum curve.
- Click the Spectral Broadening icon
 in the Apps Gallery.
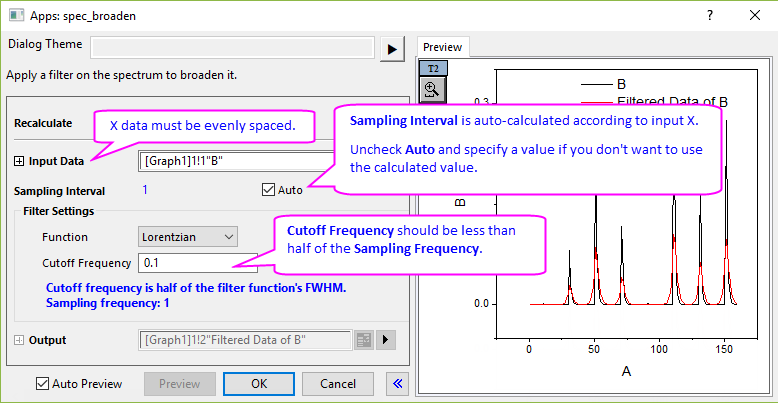
- In the opened dialog,
- Spectrum curve is auto-selected from the graph as Input Data.
- In Filter Settings branch, choose Lorentzian function as filter function in Function drop-down list.
- Enter 0.1 for Cutoff Frequency.
- Click the Preview button to display the filtered curve in the right panel.
- Click the OK button to close dialog and create the filtered data output to the source worksheet.