2.25 Simple Time Series Analysis (Pro)
Contents
Summary
The Simple Time Series Analysis app can be used to perform simple time series analysis including autocorrelation, cross correlation, differencing, and single exponential smoothing.
- Differencing: Transform a non-stationary time series into a stationary one. A stationary time series has constant mean, variance, and autocorrelation over time, which makes it easier to model and forecast.
- Single exponential smoothing: Single exponential smoothing (SES) is the method of time series forecasting used with univariate data with no trend and no seasonal pattern. It needs a single parameter called alpha (a), also known as the smoothing factor.
- Autocorrelation: Autocorrelation represents the degree of similarity between a given time series and a lagged version of itself over successive time intervals. Autocorrelation measures the relationship between a variable's current value and its past values.
- Cross correlation: Cross-correlation measures the similarity between two time series as a function of the time lag applied to one of them.
Tutorial
This tutorial will show you how to use the five buttons on the toolbar to perfrom the analysis:

Start this tutorial with the app Simple Time Series Analysis installed. If you have not installed this app, please click Add Apps button in Apps Gallery to open App Center to search and install the app.
Please download the sample project here before you tried to perfrom the analysis.
Differences tool
- Open the sample project you downloaded, switch to the first sheet. Click the app icon in App Gallery to activate the toolbar of the app.
- Click the first button DIFF to open the app dialog. Select Col(B) as Time Series, Seasonal Difference as Type, set Order to 1 and Period to 3.
- Click OK button to get the difference result.
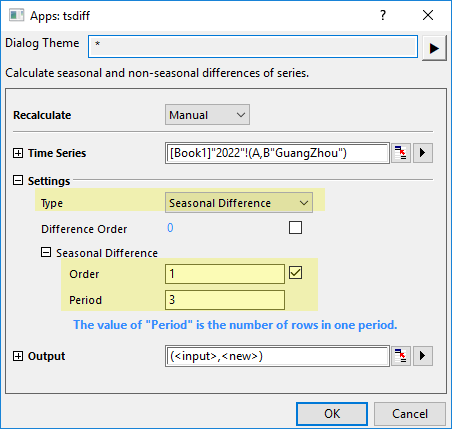
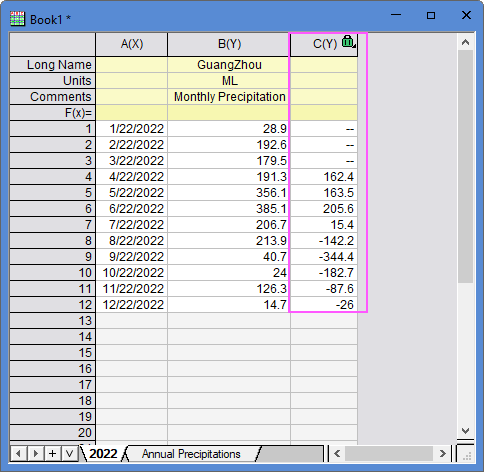
- The results you get here is calculated by formula: C[i+3]=B[i+3]-B[i]
Lag tool
- Select the col(B) again, click LAG button in the app toolbar to open the tslag dialog. Enter -1 for Lag.
- Click OK button to perfrom the analysis.
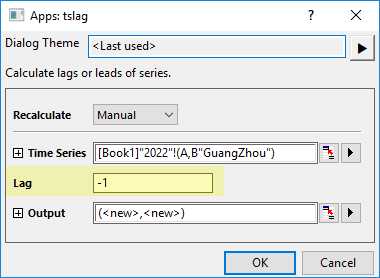
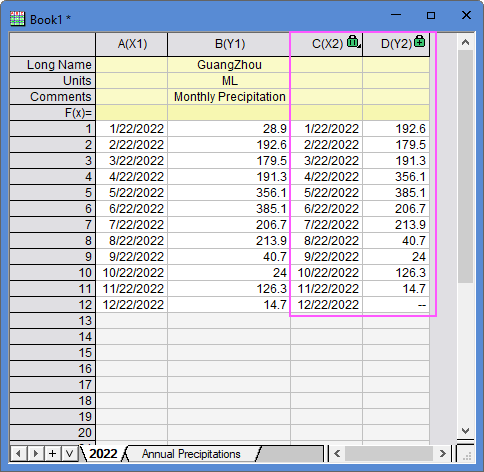
- The results are gotten by moving col(B) forward one row but keeping the original col(A).
Single Exponential Smoothing tool
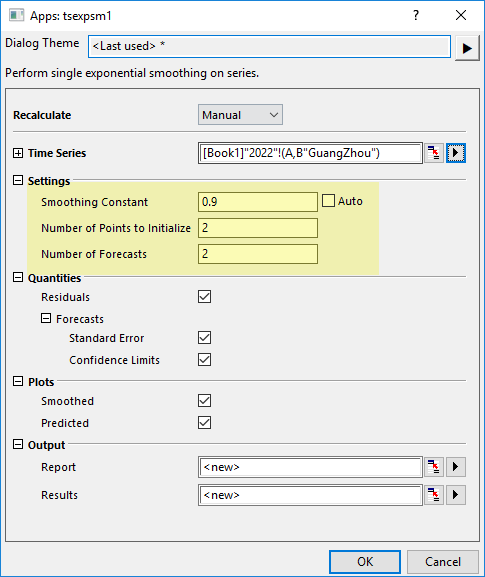
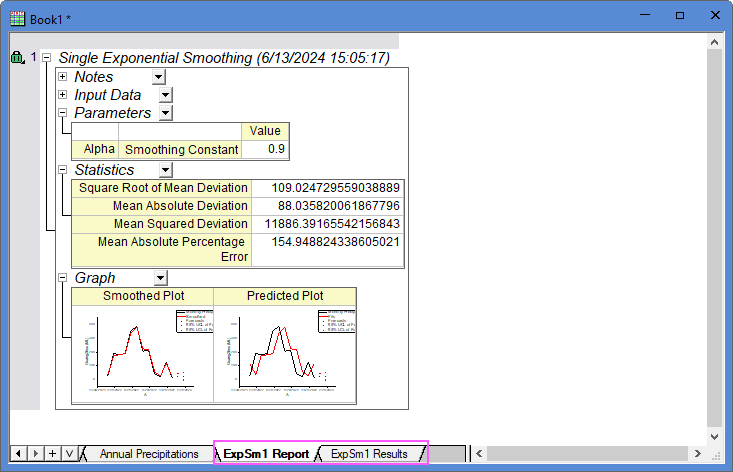
- Select Col(B) again in first sheet. Click the Single Exponential Smoothing button on the app toolbar to open the tsexpsm1 dialog. Uncheck the Auto check box for Smoothing Constant and set its value to 0.9. Set Number of Points to Initialize to 2 and Number of Forecasts to 2.
- Click OK button to perfrom the analysis. Two result sheets are created to show you the smoothing results.
Autocorrelations&Partial Autocorrelations tool
- Go to sheet "Annual Precipitations", select col(C) and click the ACF&PACF button on the app toolbar to open the tsacf dialog.
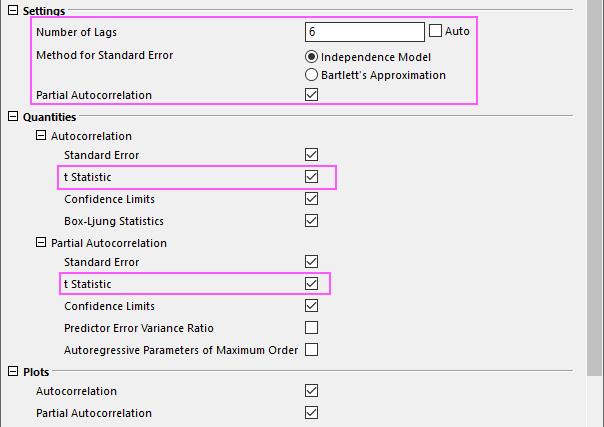
- In the dialog, uncheck Auto check box after Number of Lags box and enter value 6; choose Independent Model and keep Partial Autocorrelation be checked; Check t Statistic check box under Autocorrelation and Partial Autocorrelation branch both.
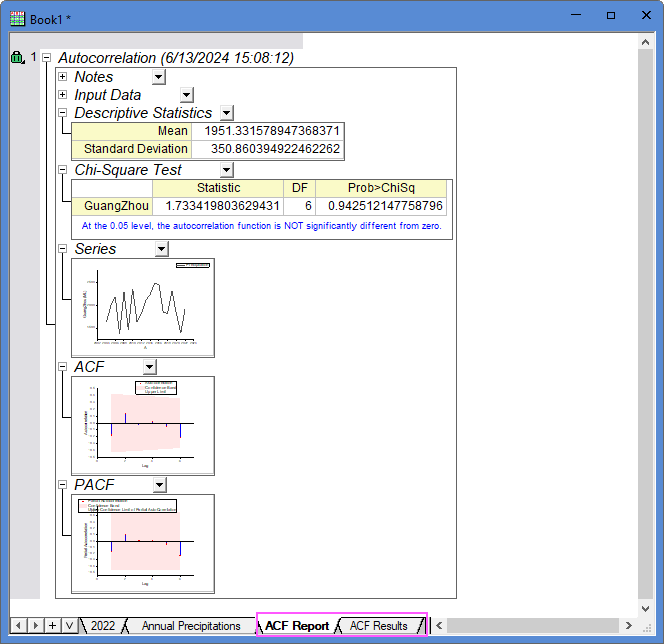
- Click OK button to get the result sheets.
Cross Correlation tool
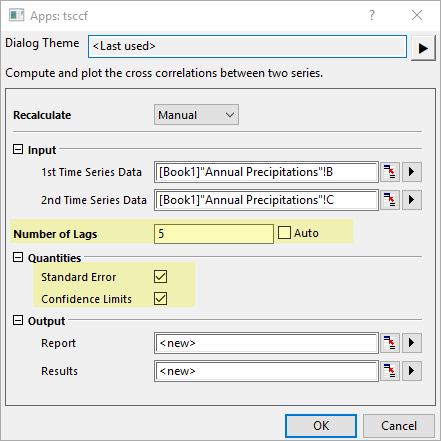
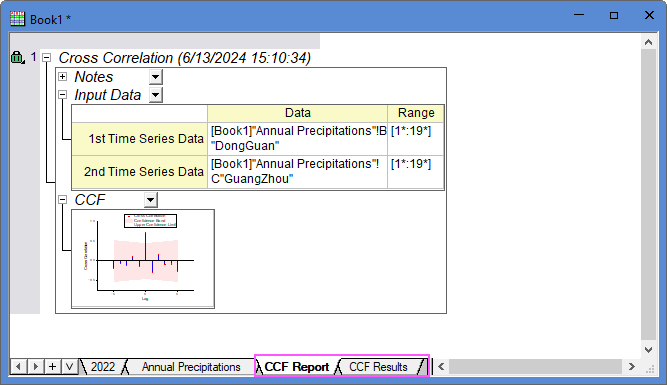
- Go to sheet "Annual Precipitations", select col(B) and col(C) to click CCF button on the app toolbar to open the tsccf dialog.
- Enter 5 for Number of Lags and keep the check box Standard Error and Confidence Limits be checked.
- Click OK button to get the result sheets.