2.13 Simple Fit
Summary
This Simple Fit app provides a convenient way to perform curve fitting. With the data plotted, simply open the tool, type the desired equation, specify initial parameters and generate your report. You do not need to even save or create a fitting function.
Linear Fit
- Download sample file Simple_Fit_App.zip. Open the Simple Fit App.opju project in the zip file.
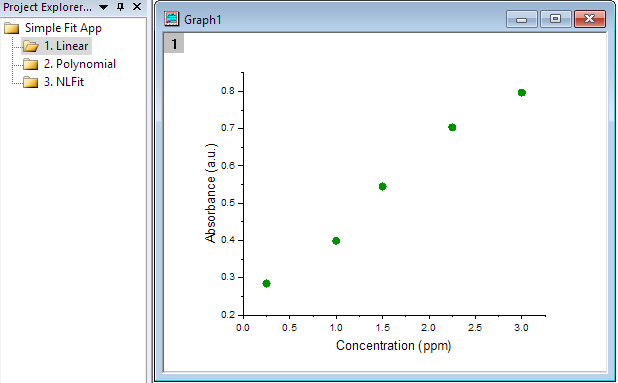
- Select 1. Linear folder in the Project Explorer. Activate Graph1 window and then click on Simple Fit icon
 from the Apps panel.
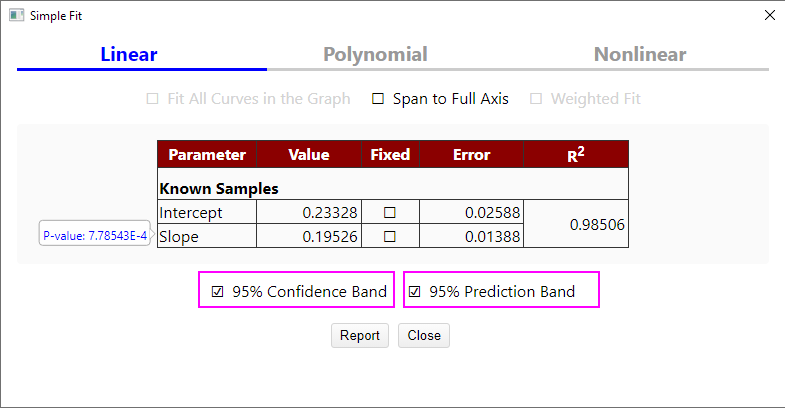
- Select Linear in the Simple Fit dialog. Check the 95% Confidence Band and 95% Prediction Band . Then click Report button.
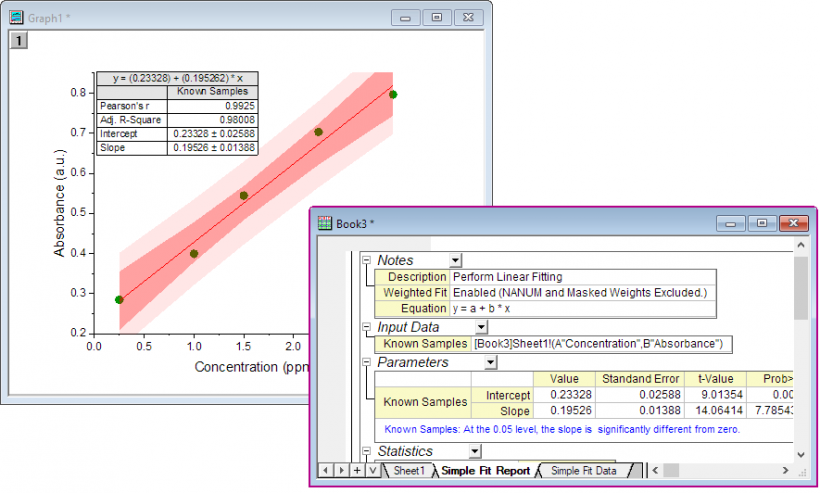
- A report table is added to the graph and a new report sheet is added to the Workbook.
Polynomial Fit
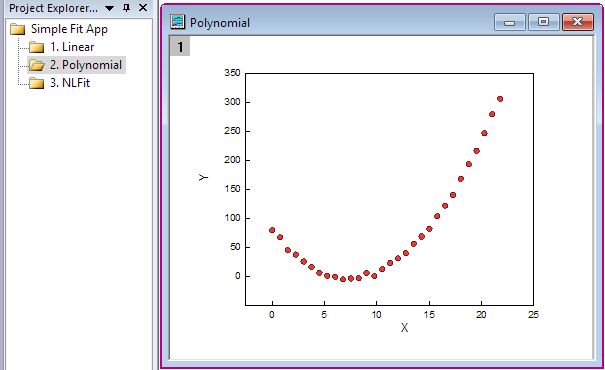
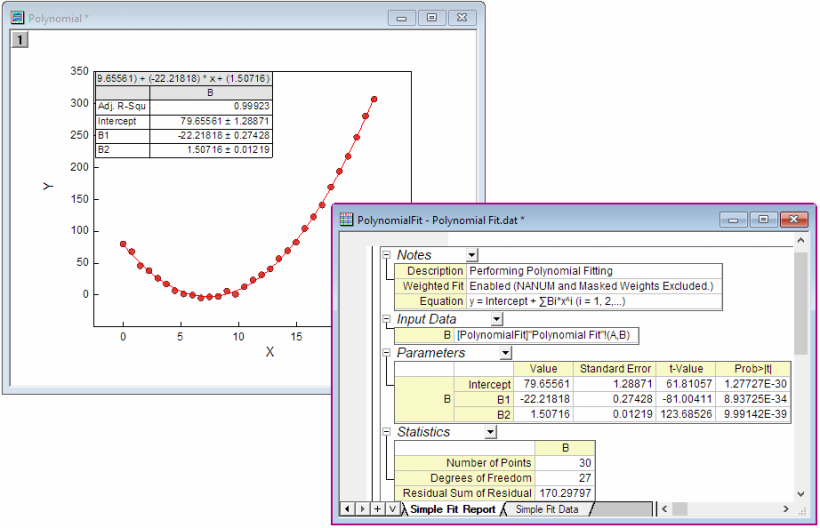
- Select 2. Polynomial folder in the Project Explorer of Simple Fit App.opju. Activate Polynomial graph and then click on Simple Fit icon from the Apps panel.
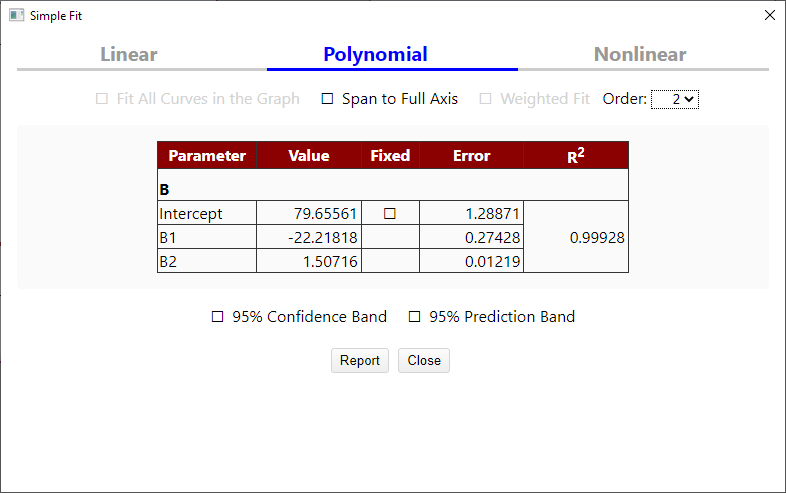
- Select Polynomial in the Simple Fit dialog. Click Report button.
- A report table is added to the graph and a new report sheet is added to the Workbook.
Nonlinear Fit
Example 1
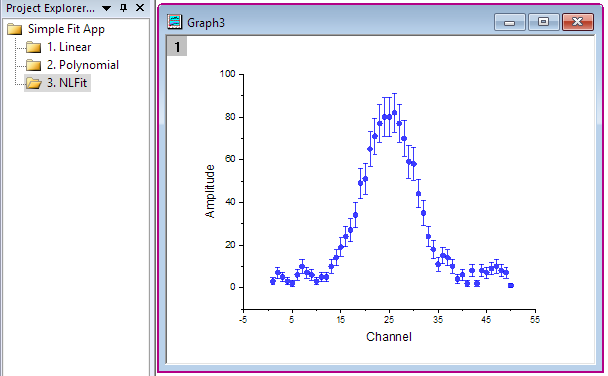
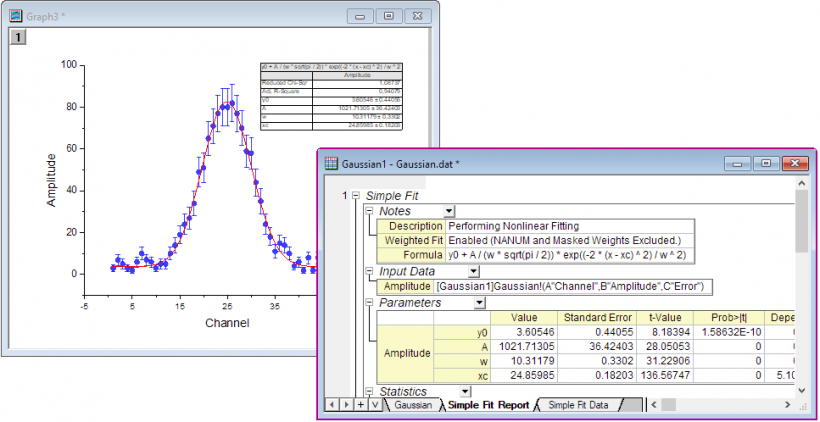
- Select 3. NLFit folder in the Project Explorer of Simple Fit App.opju. Activate Graph3 window. This is a Gaussian curve with error bars. While the Simple Fit app provides a few built-in Gaussian functions that can be used for fitting, in this example we will show how to define a new function within the app.
- Click on Simple Fit icon from the Apps panel.
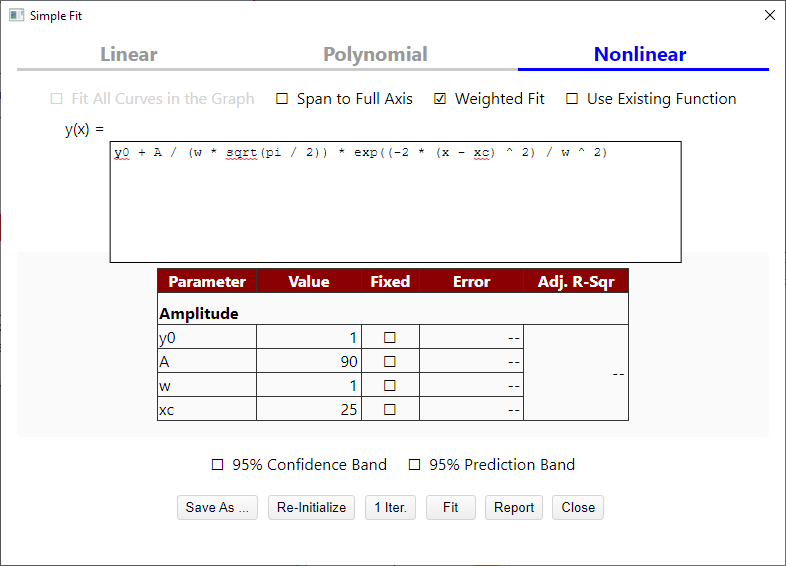
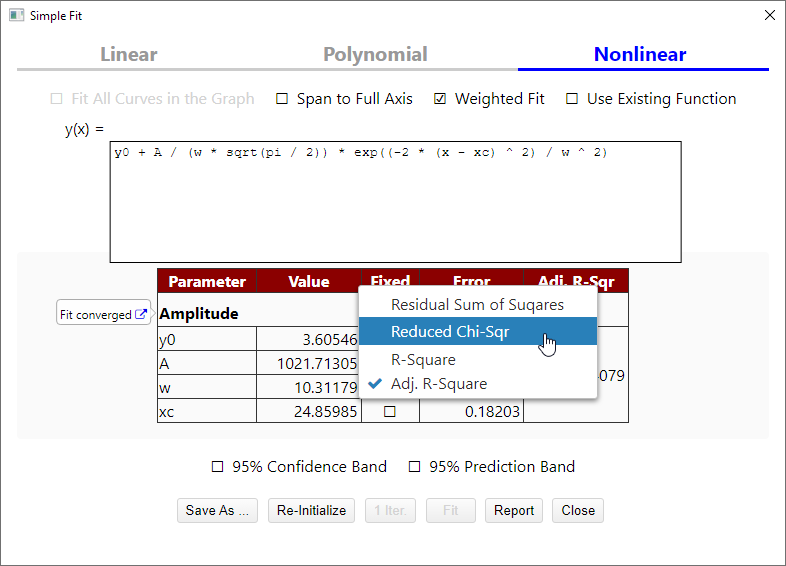
- Select Nonlinear in the Simple Fit dialog. Input the defined equation in the dialog.
y0 + A/(w*sqrt(pi/2))*exp((-2*(x-xc)^2)/w^2)
Then define the values for the parameters: A=90, xc=25.
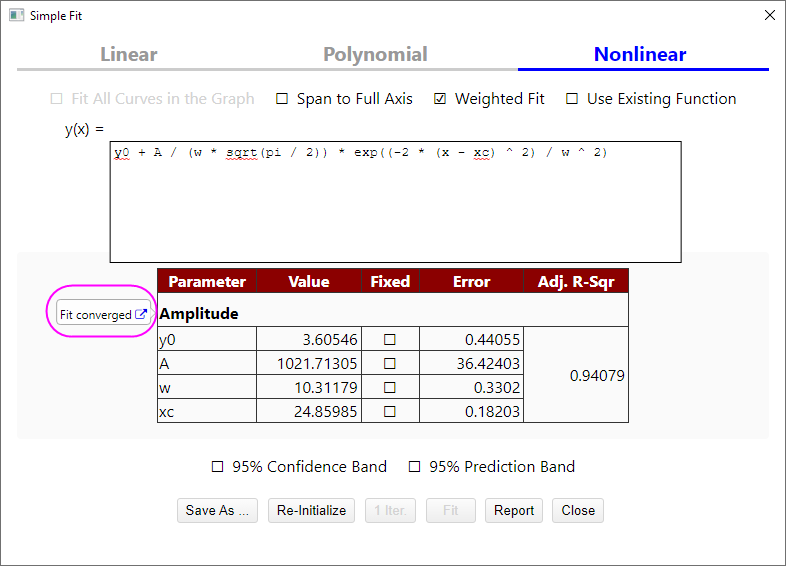
- Click on Fit button and the fit converges.
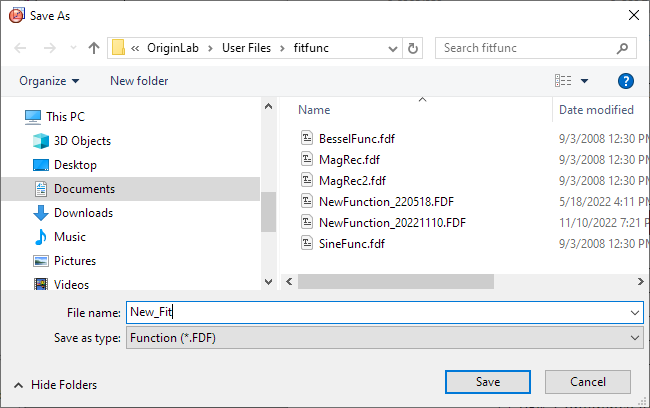
- Click on Save As... button, then you can save this new fitting function in the User File Folder and to use it in the future.
- For output table, you also can change the output value. Right-click on the Adj. R-Sqr, select Reduced Chi-Sqr in the drop-down list.
- Click Report button. A report table is added to the graph and a new report sheet is added to the Workbook.
Example 2
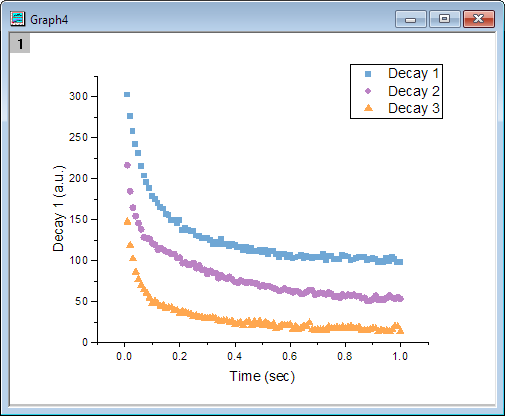
- Activate Graph4 window. In this sample, there are 3 curves, and we will use an existing function to fit all curves in the graph.
- Click on Simple Fit icon from the Apps panel.
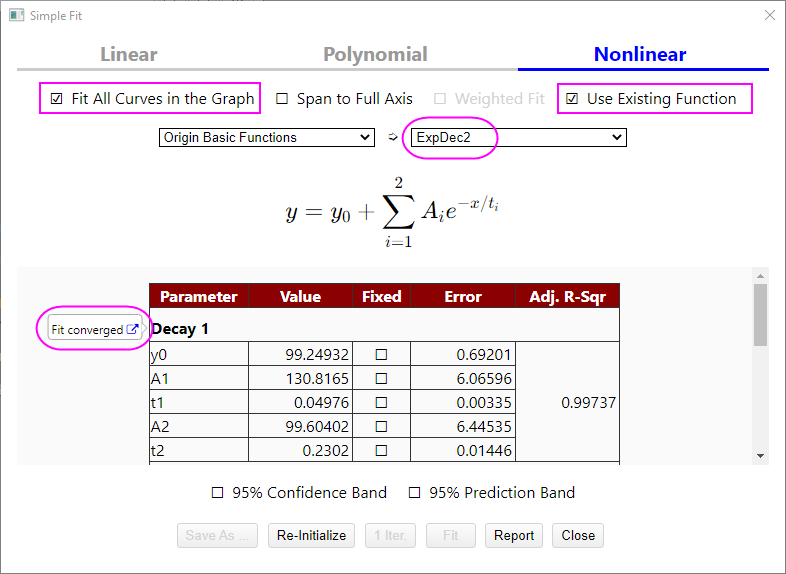
- Select Nonlinear in the Simple Fit dialog. Check Fit All Curves in the Graph and Use Existing Function check box. In the Origin Basic Function group, select ExpDec2 as fitting function. Click Fit button. The fitting is converged.
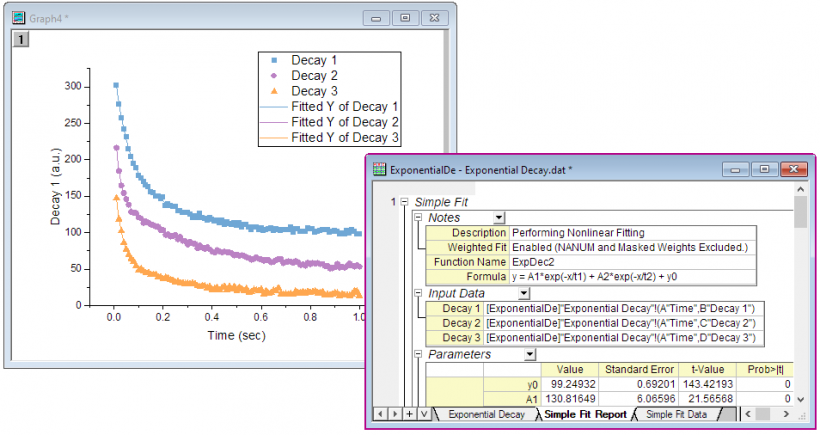
- Click Report button. A report table is added to the graph and a new report sheet is added to the Workbook.