Hinweis:Dieser Abschnitt ist nur in englischer Sprache verfügbar. Wir bitten um Ihr Verständnis.
2.32 Redundancy Analysis (Pro)
Contents
Summary
This Redundancy Analysis app is to run redundancy analysis, also called RDA, on observations with both explanatory variables and response variables.
 | Limitations
|
Tutorial
- Download the project file from here and open it in Origin
- Click the Redundancy Analysis icon,
 , from Apps Gallery.
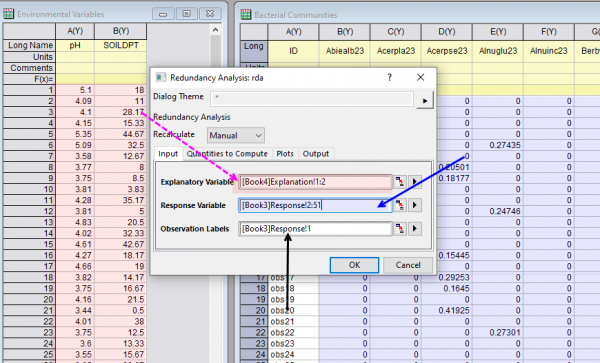
 - In the opened dialog, Set Explanatory Variables to be column A and B in Book 4 (book "Environmental Variables"), set Response Variables to be column B ~ AY in Book 3,(book "Bacterial Communities") and Observation Labels to be column A. Accept all other default settings and click OK
- Select sheet RDA Report.
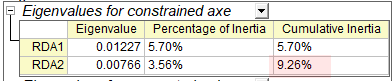
- In the Eigenvalues for constrained axe table, we can see the two explanatory variables (pH and SOILDPT) explained 9.26% of the variance,
-
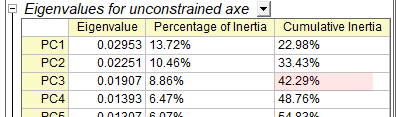
- Look at the Eigenvalues for unconstrained axe table, we can see the first 3 PC explained the 42.29% of the variance
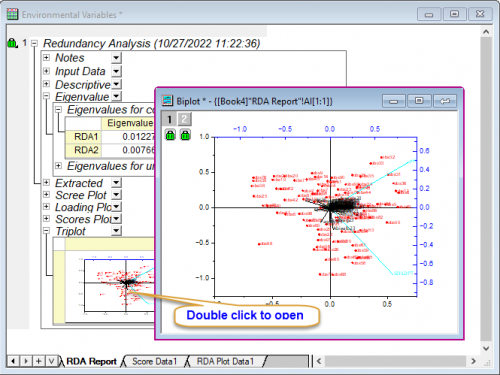
- And we can look at the triplot for visualization of the response and explanatory variables.
-