2.32 Redundancy Analysis (Pro)
Contents
Summary
This Redundancy Analysis app is to run redundancy analysis, also called RDA, on observations with both explanatory variables and response variables.
Limitations
|
Tutorial
- Download the project file from here and open it in Origin
- Click the Redundancy Analysis icon,
 , from Apps Gallery.
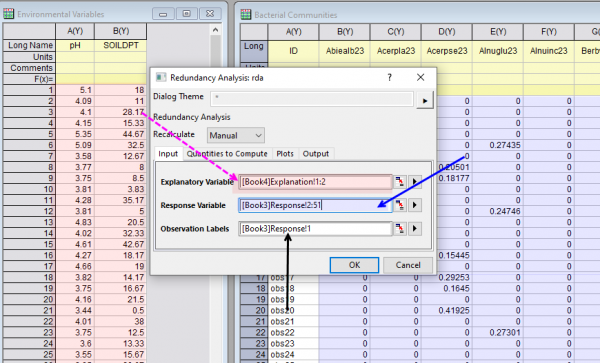
 - In the opened dialog, Set Explanatory Variables to be column A and B in Book 4 (book "Environmental Variables"), set Response Variables to be column B ~ AY in Book 3,(book "Bacterial Communities") and Observation Labels to be column A. Accept all other default settings and click OK
- Select sheet RDA Report.
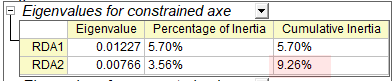
- In the Eigenvalues for constrained axe table, we can see the two explanatory variables (pH and SOILDPT) explained 9.26% of the variance,
-
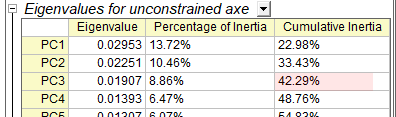
- Look at the Eigenvalues for unconstrained axe table, we can see the first 3 PC explained the 42.29% of the variance
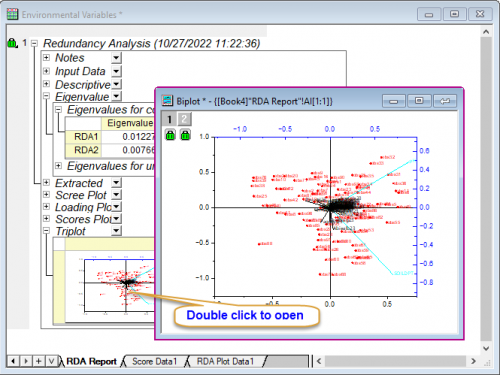
- And we can look at the triplot for visualization of the response and explanatory variables.
-