Hinweis:Dieser Abschnitt ist nur in englischer Sprache verfügbar. Wir bitten um Ihr Verständnis.
2.75.4 Process Overview
More information:
Introduction
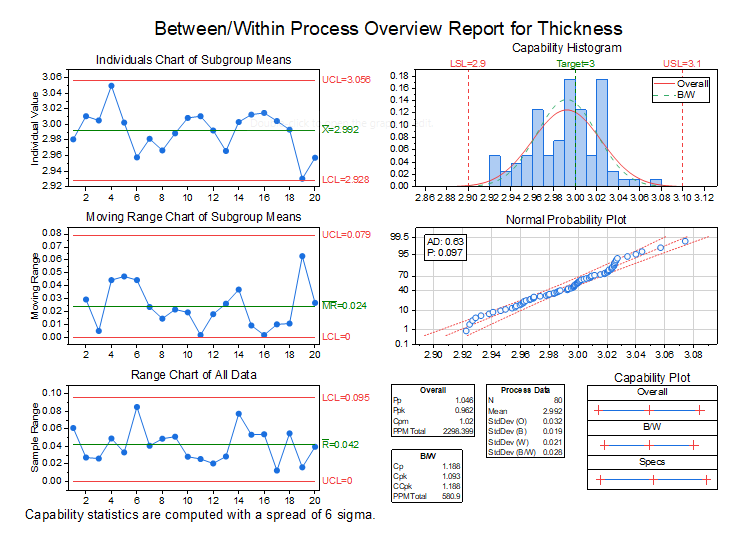
The Process Overview generates a combination report with charts below. It enables you to assess the quality or capability of a process in a glance
| Xbar / Individuals charts | Access whether the process is stable |
|---|---|
| R / S / MR chart | Monitor the process variation and assesses whether the process variation is in control |
| Run chart | Study the data trends or pattern |
| Probability plot | Verify that a chosen distribution fits your data. |
| Capability histogram | Visually compare the distribution of data from your process to the specification spread |
| Capability plot | |
| Capability statistics | Assess capability of your process quantitatively. |
Processing
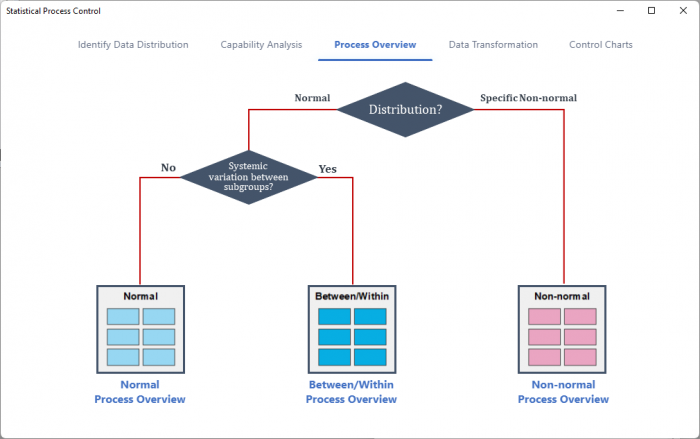
Select a process overview tool based on your data