Hinweis:Dieser Abschnitt ist nur in englischer Sprache verfügbar. Wir bitten um Ihr Verständnis.
1.5 Plot Sub Matrix
Contents
Summary
This Plot Sub Matrix app is used to interactively examine selected sub range of a matrix as a 3D surface, contour or image plot.
Tutorial
- Download this Plot_Sub_Matrix_App.zip file. Open the PlotSubMatrix.opju in this zip file.
- Active the Excitation Emisison Map matrix, and click the Plot Sub Matrix icon
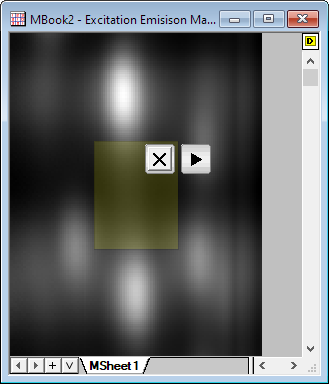
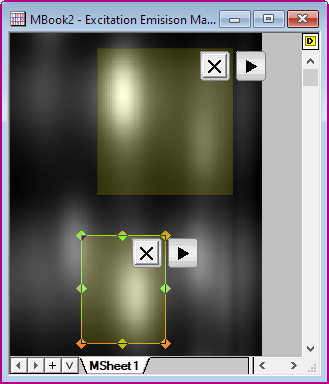
 in the Apps Gallery, then an ROI object will be added to the matrix.
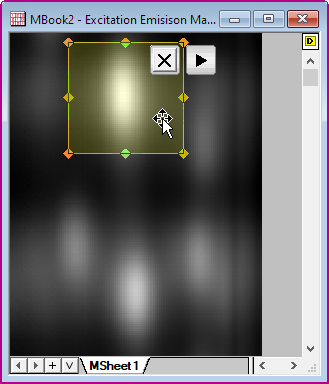
- Resize and position the ROI as desired.
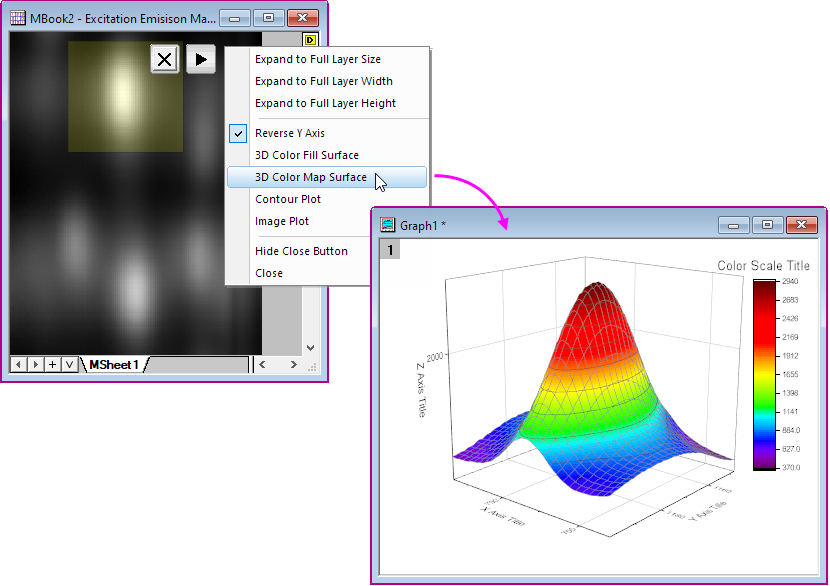
- Press the triangle button at the upper right corner of the ROI box, and choose 3D Color Map Surface. A separate graph window will open with a 3D Surface plot of the selected sub range.
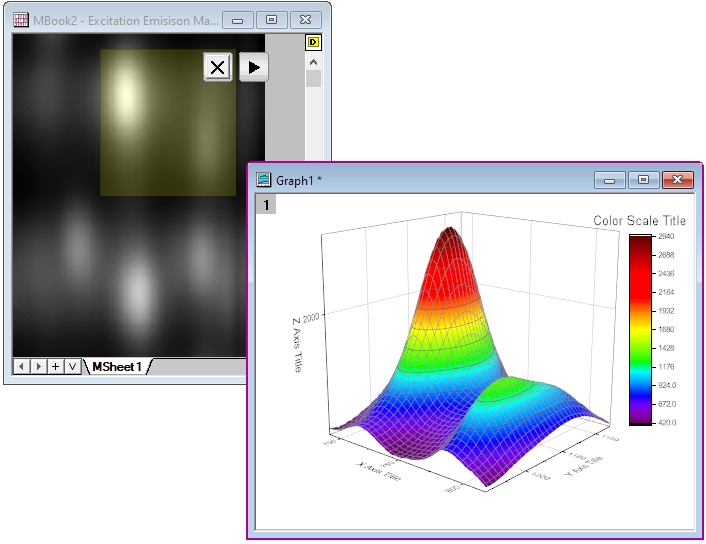
- Move or resize ROI object. The graph will automatically update.
- Active the matrix, and click the Plot Sub Matrix icon again, then a new ROI object is added.
- Click "x" button to close the ROI box. The plot will not be deleted when ROI is closed.