1.5 Plot Sub Matrix
Contents
Summary
This Plot Sub Matrix app is used to interactively examine selected sub range of a matrix as a 3D surface, contour or image plot.
Tutorial
- Download this Plot_Sub_Matrix_App.zip file. Open the PlotSubMatrix.opju in this zip file.
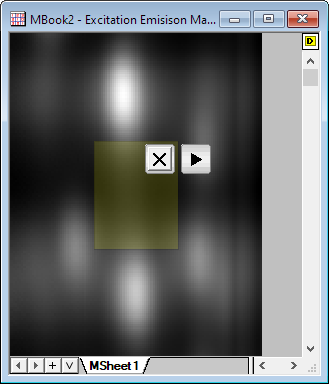
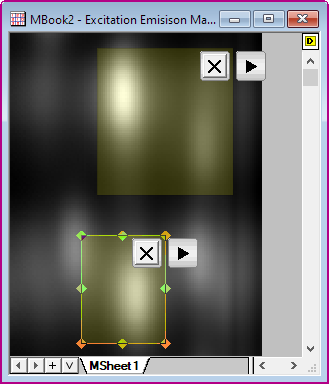
- Active the Excitation Emisison Map matrix, and click the Plot Sub Matrix icon
 in the Apps Gallery, then an ROI object will be added to the matrix.
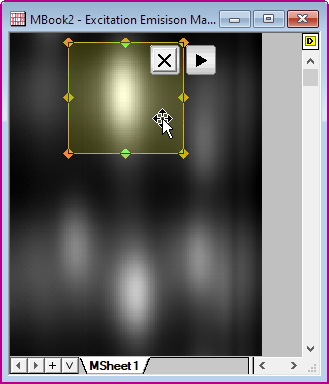
- Resize and position the ROI as desired.
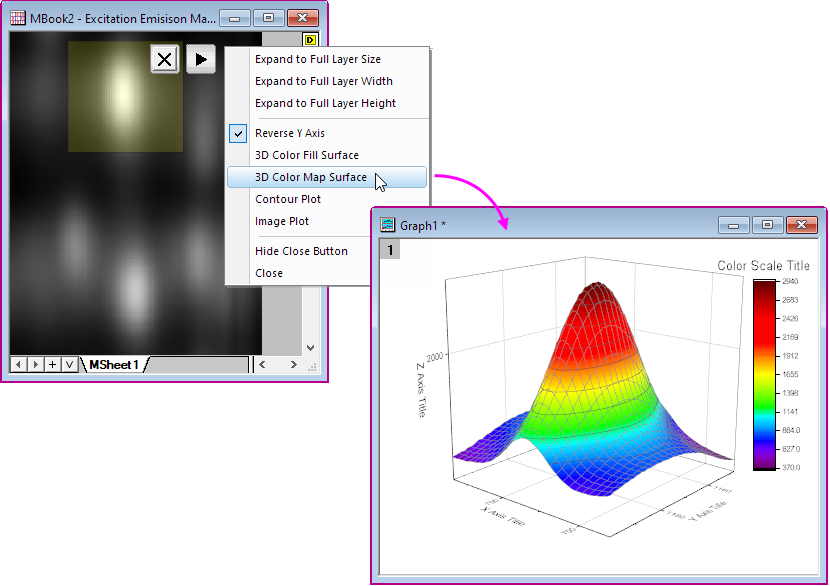
- Press the triangle button at the upper right corner of the ROI box, and choose 3D Color Map Surface. A separate graph window will open with a 3D Surface plot of the selected sub range.
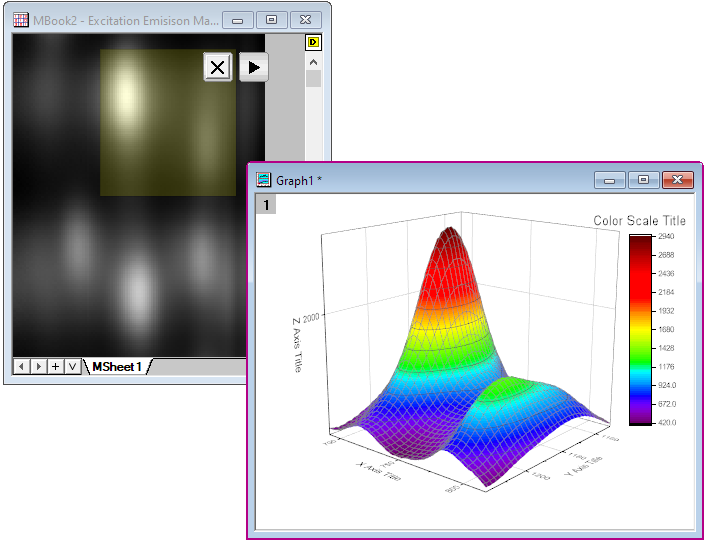
- Move or resize ROI object. The graph will automatically update.
- Active the matrix, and click the Plot Sub Matrix icon again, then a new ROI object is added.
- Click "x" button to close the ROI box. The plot will not be deleted when ROI is closed.