2.21 Piecewise Fit (Pro)
Summary
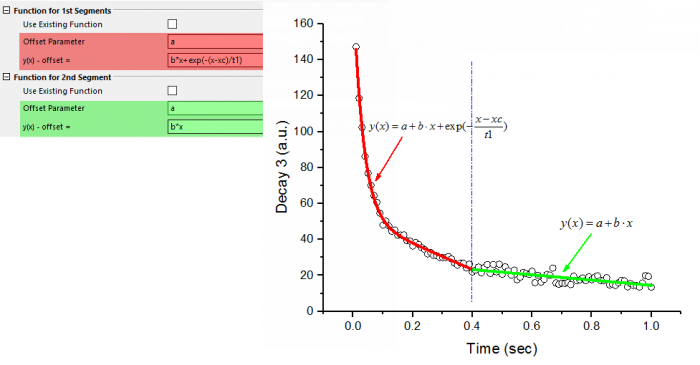
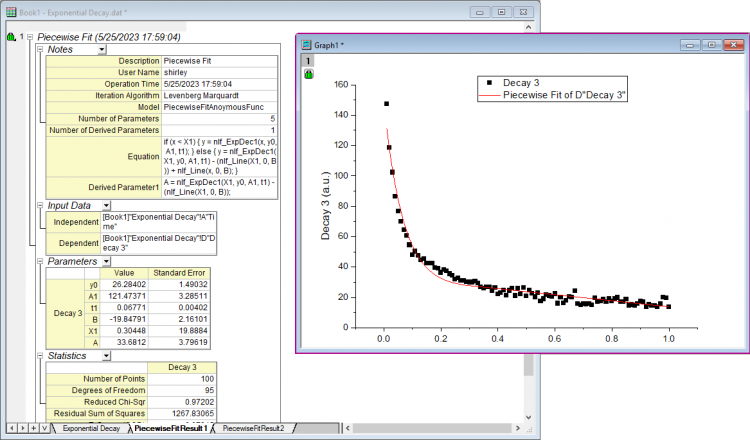
The Piecewise Fit app can be used to fit two or three segments of a data plot with same or different fitting function.
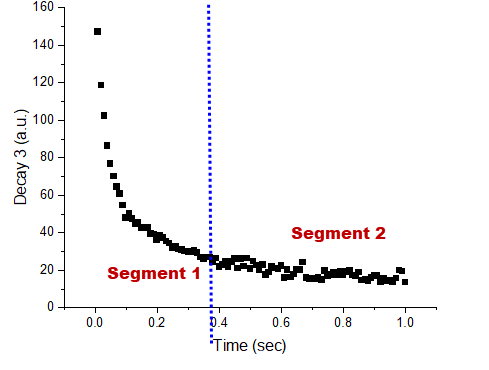
In this tutorial, We are going to fit a curve with a piecewise function which has two segments. The first segment is exponentially decaying and should be fitted with the function "ExpDec1"; the second segment is a straight line.
Tutorial
- Start this tutorial with the app Piecewise Fit installed. If you have not installed this app, please click Add Apps button in Apps Gallery to open App Center to search and install the app.
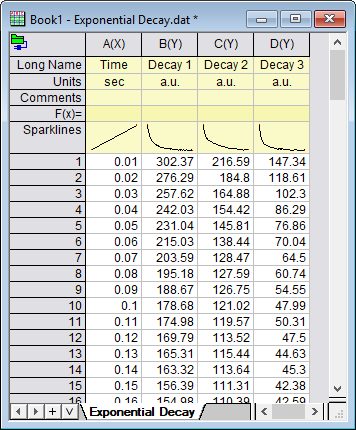
- New a worksheet, select Data> Connect To Files : Text/CSV menu to import the sample file "<Origin Program Folder>Piecewise Fit\Exponential Decay.dat".
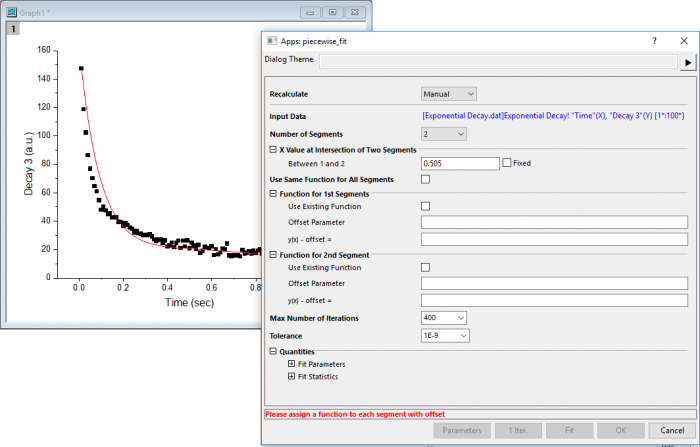
- Highlight col(D) to plot it as a scatter plot. Click the app icon
 to open the app dialog.
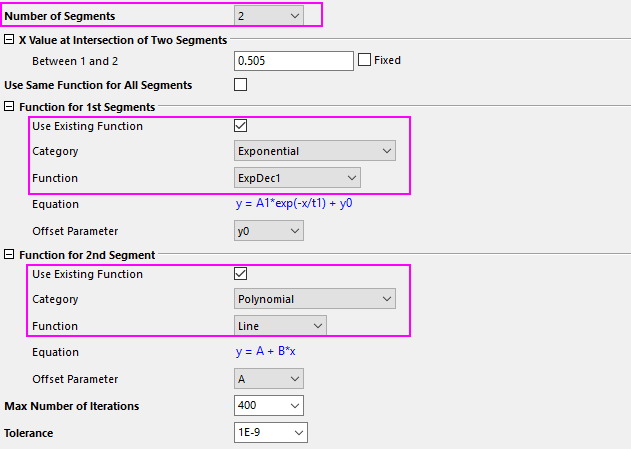
- Set Number of Segments to 2; Choose Use Existing Function for 1st segment and 2nd segment both. And then, select function "ExpDec1" and "Line" for 1st segment and 2nd segment seperately.
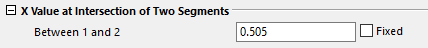
- If you know the intersection of two segements, you can enter it into Between 1 and 2 box and check the Fixed check box to fix it. In thos example, we don't know the intersection point and don't want to fix it.
- If you don't want to use the built-in functions, you can uncheck Use Existing Function box and enter the funtion equations as below:
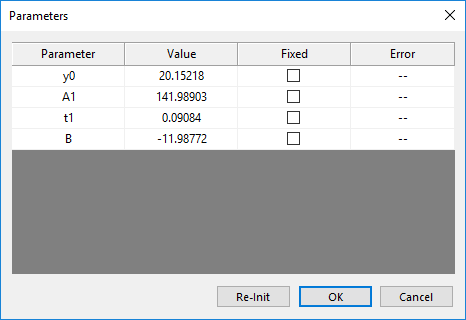
- If you want to set initial values for the parameters, you can click Parameters button at bottom of the dialog to open the Parameters dialog.
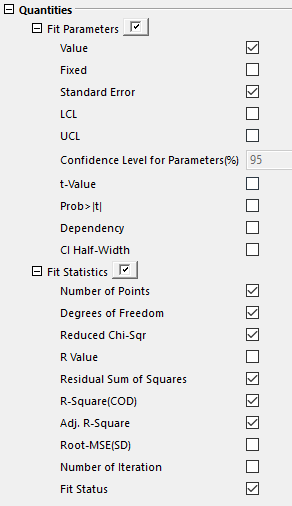
- If you want to customize the output results, you can exapnd the Fit Parameters and Fit Statistics branch to check the quantities you want to output,
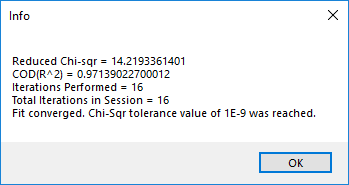
- Once you did the settings well, you can click 1 Iter. button to prefrom1 iteration of fitting. Click Fit button to do the fitting. A Info message will popup to tell you the fitting status.
- Click OK button to close the message and then click OK button to close the dialog and output the fitting results.