2.31 Overlap Area
Contents
Summary
The purpose of the Overlap Area App is to calculate the overlapping area between two plots and output a graph of the overlapping area, the two source plots, and the integration results.
Tutorial
- With a worksheet window activated, select Data: Connect to File: Text/CSV in the menu to import the sample file <Origin program folder>\Samples\Samples\Curve Fitting\Lorentzian.dat.
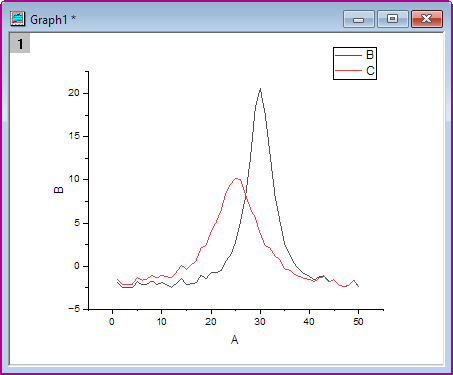
- Highlight Column B and C, and select Plot: Basic 2D: Line to create lines plot.
- Active the Line graph window, and then click on Overlap Area icon
 from the Apps panel.
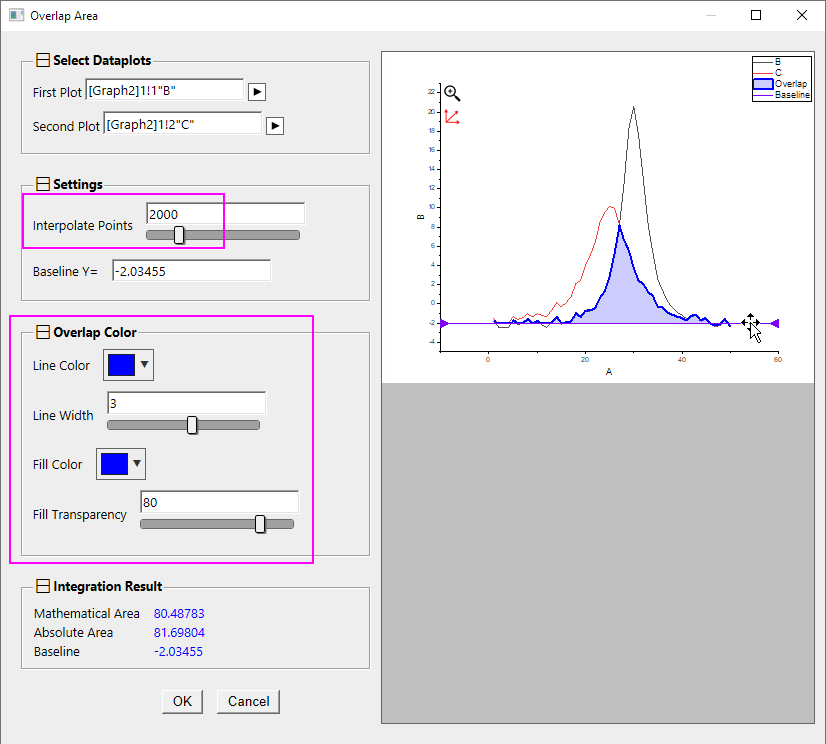
- In the Overlap Area dialog, set the Interpolation Point to 2000 in the left panel, then drag the baseline on preview graph in the right panel to interactively change the baseline Y value. Also, you can customize Line Color and Fill Color under Overlap Color section.
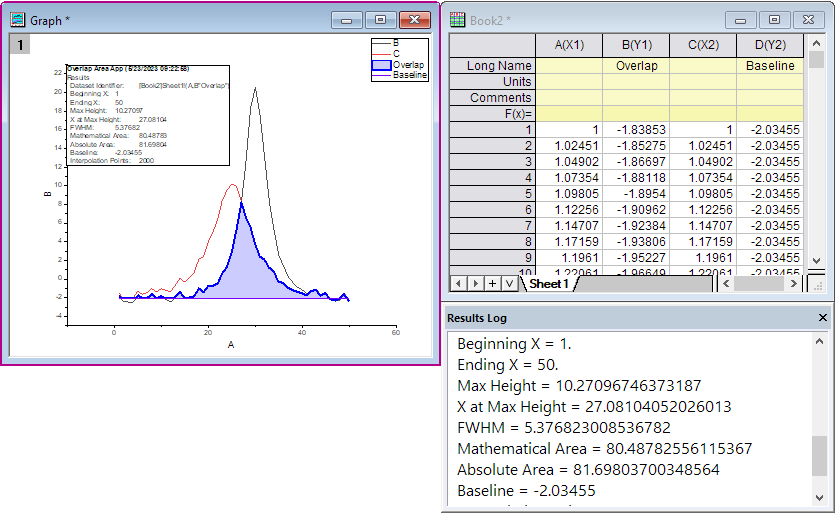
- Click OK button. It will output a graph of the overlapping area along with the two source plots used and a label box with the integration results, and a workbook with overlap line and baseline dataset. Integration results are also output to the Results Log.