2.42.6.2 Overview of Optimize Response Results
Contents
Input Data
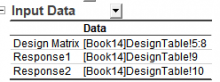
Lists the worksheet data behind the model
- Design Matrix: the source design table
- Response: the column(s) being optimized
Goal

Restates the optimization setup from the Goal tab. It helps to onfirm the settings match your intent before trusting the solution.
Solution
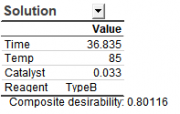
The recommended operating conditions
Factor settings
The numeric level for each continuous factor and the level for each categorical factor
Composite desirability (D)
The overall optimization score (0–1, geometric mean of individual desirabilities). Higher = better overall satisfaction of all goals
Prediction

Statistics for the response(s) at the solution:
Fit
Predicted mean response at the recommended settings
SE of Fit
Standard error of that prediction
95% LCL / UCL
Confidence interval - plausible range for the true mean
95% LPL / UPL
Prediction interval - plausible range for individual confirmation runs
Desirability
Individual desirability (d) of each response at the solution
Optimization Plot
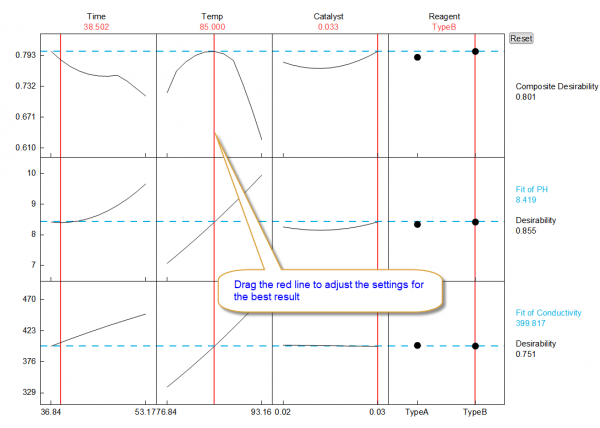
An interactive graph with:
- One column per factor — top area showing each factor's optimal setting (drag the red lines to explore "what-if" scenarios; predictions update live)
- One row per response — fitted curves showing how the response changes with each factor, with:
- Red reference lines marking the optimal settings and predicted response
- A blue dashed line showing the fitted value
- Desirability readout — current fit and composite desirability, updated as you move the red lines