2.42.6.1 The Optimize Response Dialog Box
Contents
Supporting Information
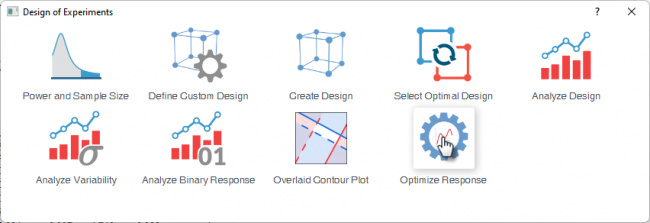
To open the Optimize Response dialog
- Activate a report sheet generated from the Analyze Design, Analyze Variability or Analyze Binary Response
- Select Statistics: Quality Improvement: Design of Experiment from Origin menu
- Select the Optimize Response icon
 | The feature is available only for |
 | Topics for Further Reading: |
Goal
Setup Table
| Response | The response(s) selected from your stored model; click the row to edit its settings |
|---|---|
| Goal |
|
| Target | The value to hit - required and enabled only when Goal = Target |
| Lower Limit | Boundary below which the response is unacceptable |
| Upper Limit | Boundary above which the response is unacceptable |
| Weight | Shape of the desirability curve within the limits |
| Importance | Relative priority of this response vs. others (1 = equal) when multiple responses are optimized |
Buttons
| View Model | Opens the stored model equation for the selected response so you can verify the fitted terms before optimizing |
|---|---|
| Set Lower/Upper Limits | Automatically populates limits from the actual response data range |
Settings
The Settings tab configures how the optimization algorithm searches for the best factor settings.
| For Mixture Design, only the Iterations setting is available - the Constraints Table and Initial Value options do not apply to mixture designs. All other design types have the full set of options described below.
|
Constraints Table
| Factor | Factor name from the stored model |
|---|---|
| Constraint | Dropdown to choose how the factor participates in the search
|
| Hold Value | The fixed level for a factor that is not optimized |
| Lower Bound | Lowest numeric value the optimizer may use (numeric factors only) |
| Upper Bound | Highest numeric value the optimizer may use (numeric factors only) |
Initial Value
The toggle enables custom starting points for the optimization algorithm.
- On: Enter an Initial Value for each free numeric factor.
- Off: Origin automatically selects starting values across the factor space
Output
The tab controls which elements appear in the results. See Overview of Optimize Response Results for guidance on interpreting the results.
| 95% Confidence Limits | Adds the LCL/UCL columns to the Prediction table |
|---|---|
| 95% Prediction Limits | Adds the LPL/UPL columns to the Prediction table - the interval for individual confirmation runs |
| Optimization Plot | Generates the interactive optimization graph with factor sliders and fitted response curves |
| Note: For Analyze Binary Response and Analyze Variability, the Prediction table does not include 95% LPL/UPL prediction limits - the 95% Prediction Limits option does not apply to these analysis types. |