3.4 Onset Of Slope
Summary
Onset Of Slope app is used to estimate the onset of slope change in a graph curve. This app allows you to place up to four Region-of-Interest (ROI) objects on a graph, and perform a linear regression on data points within each ROI. Each ROI should delineate a line segment of uniform slope. The app then calculates the intersection points of adjacent linear regression lines.
Tutorial
- Create a new workbook by clicking New WorkBook button
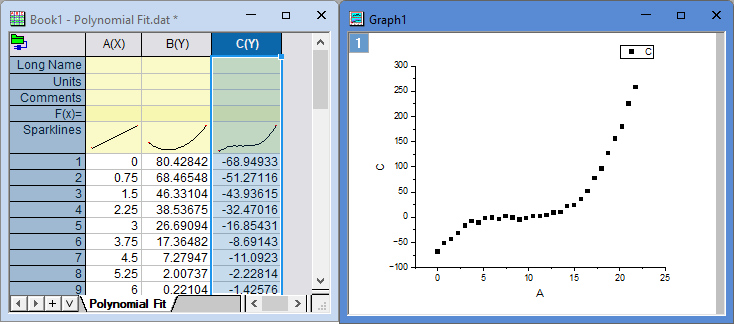
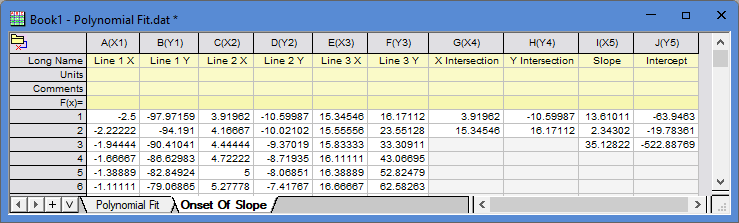
 on the Standard toolbar. With the empty worksheet activated, select menu Data: Connect to File: Text/CSV. Browse to the folder <Origin Installation Directory>\Samples\Curve Fitting\ and select the data file Polynomial Fit.dat. Accept default settings to import.
- Click column C's header to select this column. Choose menu Plot> 2D Basic: Scatter to make a scatter plot.
- Click the Onset Of Slope icon
 in the Apps Gallery.
- In the opened dialog,
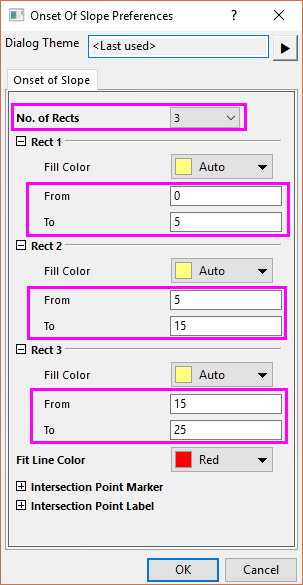
- set No. of Rects to 3, which will put 3 ROI boxes to the graph
- set the From and To for each ROI as follow:
- Rect 1 from 0 to 5,
- Rect 2 from 5 to 15,
- Rect 3 from 15 to 23.
- Note that after ROI boxes are added to the graph, you can always move or resize the rectangle boxes to adjust their ranges.
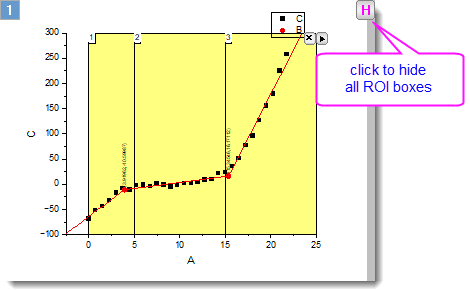
- Keep other settings as default and click OK button. 3 ROI boxes are added to the graph. Linear regression is performed to fit the data inside each section, and the intersection point of fitted lines of adjacent sections are found and tagged to the graph.
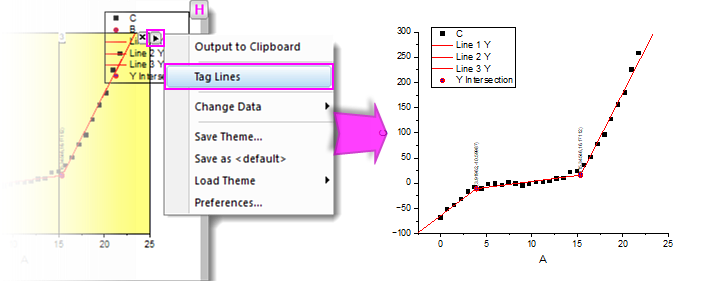
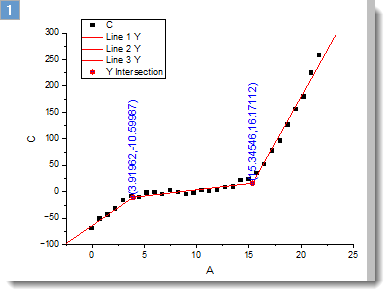
- Click the triangle button at the top-right corner of the 3rd ROI to bring up the context menu. Choose Tag Lines. After clicking the X button to remove ROI boxes, the fitted lines and tagged intersection points remains on the graph.
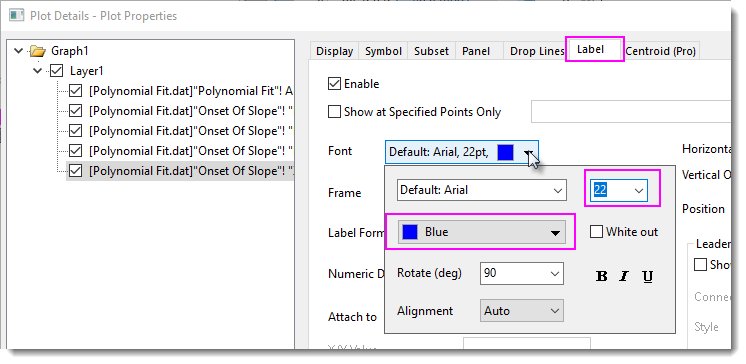
Also, the related result data is put to a new worksheet. - Finally let’s customize the text labels a bit. Double click on the label to open the Plot Details dialog. On Label tab, change Color to blue, and Size to 22, then click OK.
And get the final result as below picture shows.
Dialog Settings
Onset of Slope Tab
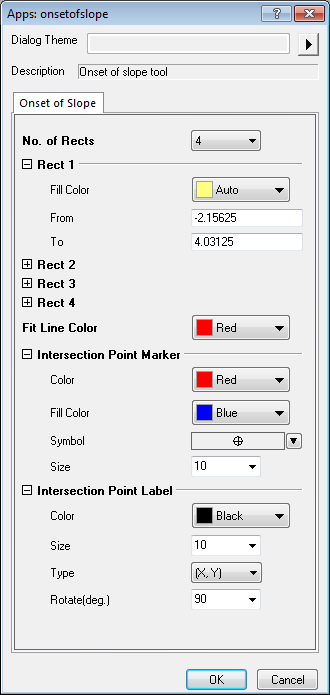
| No. of Rects | Specify how many rectangles to add to the graph for section of data. |
|---|---|
| Rect 1 | Settings for the 1st rectangle.
|
| Rect 2 | Same as Rect 1. |
| Rect 3 | Same as Rect 1. It is available when No. of Rects is 3 or 4. |
| Rect 4 | Same as Rect 1. It is available when No. of Rects is 4. |
| Fit Line Color | Specify the color of each section's fit line. |
| Intersection Point Marker | Settings for the marker of intersection point.
|
| Intersection Point Label | Settings for the label of intersection point.
|
Fly-out Menu
Click the button ![]() at the upper-right corner of the layer to expand the fly-out menu, which includes the following options.
at the upper-right corner of the layer to expand the fly-out menu, which includes the following options.
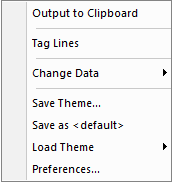
| Output to Clipboard | Output results to clipboard |
|---|---|
| Tag Lines | Tag the current results (fit line and intersection point info) to the graph. |
| Change Data | Select the source data set. This is applicable only when there are multiple curves on the graph. |
| Save Theme | Save the settings as a theme. |
| Save as <default> | Save the settings as default theme. |
| Load Theme | Load theme settings. |
| Preferences | Open the Onset Of Slope Preferences dialog. |