1.13 Means Plot
Contents
Summary
This Means Plot app can be used to create 2D means-with-error plot for grouped data.
Tutorial
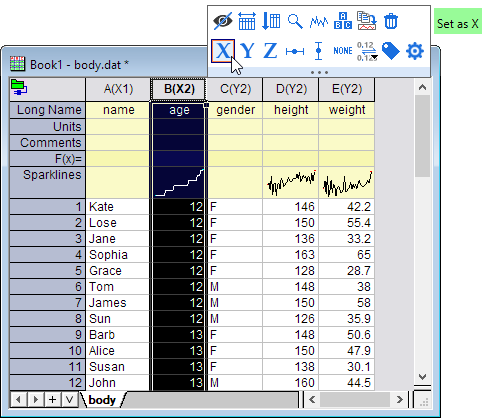
- With a worksheet window activated, select Data: Connect to File: Text/CSV in the menu to import the sample file <Origin program folder>\Samples\Samples\Statistics\body.dat.
- Set Column B as X by Mini Toolbar button.
- Highlight Column B and E, and then click on Means Plot icon
 from the Apps panel.
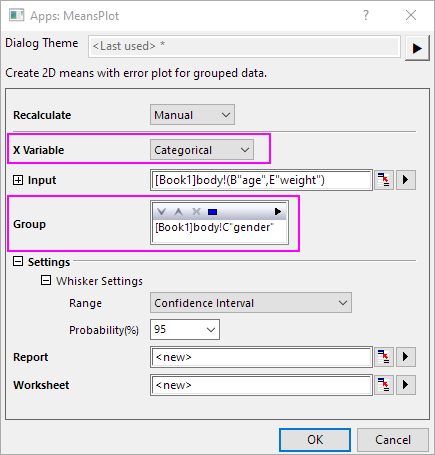
- In the dialog, set X Variable as Categorical. Select Column C gender as the Group. Then click OK
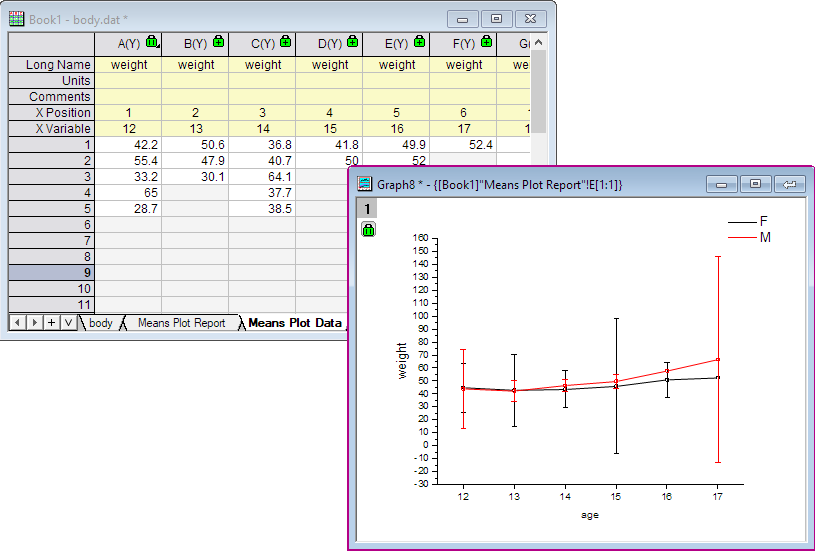
- A report sheet and a report data sheet will be created. A Means Plot graph created is embedded in the report sheet.