2.38 Mask or Change Data in Contour
Contents
Summary
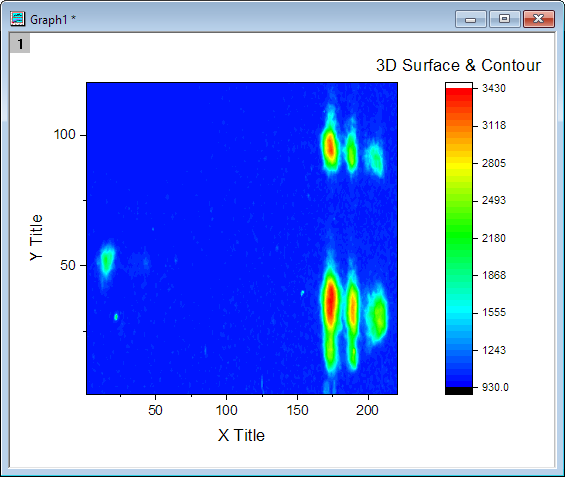
This Mask or Change Data in Contour app can be used to mask or change data within a region of interest (ROI) in a contour plot. The ROI can be rectangle, ellipse or free hand drawn shape.
Tutorial
- With a worksheet window activated, select Data: Import Form File: Single ASCII in the menu to import the sample file <Origin Program Folder>\Samples\Curve Fitting\Multiple Linear Regression.dat with the default import settings.
- Highlight whole worksheet, select Plot: Contour: Contour to plot Contour with default setting.
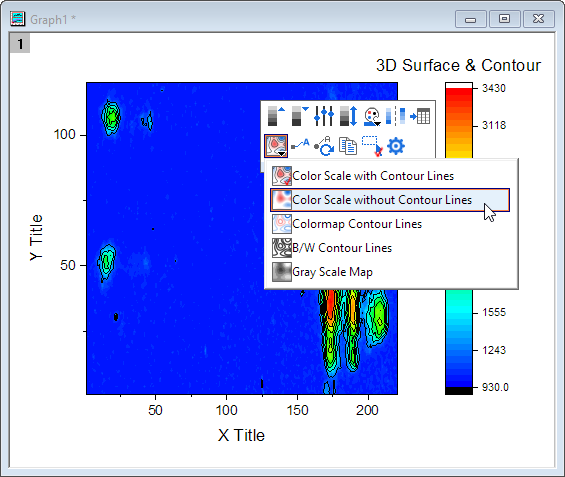
- Use Mini Toolbar button to hide the Contour Line.
- Activate Contour graph window and then click on Mask or Change Data in Contour icon
 from the Apps panel.
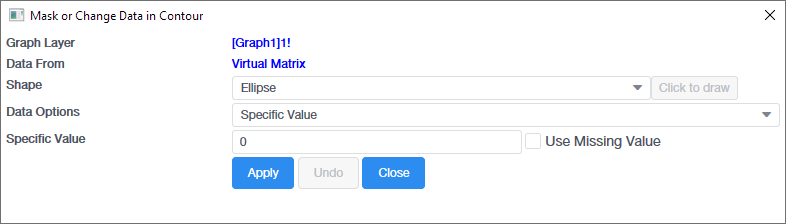
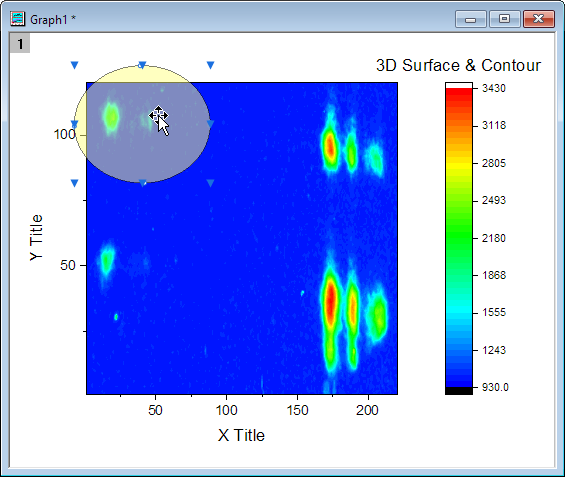
- The Mask or Change Data in Contour dialog will pop-up, and a region of interest object (ROI) is added on the graph.
- You can select Ellipse, 'Rectangle or Free Hand shape for the ROI object. Here, we keep to use Ellipse and then drag the object cover the data we hope to make or change.
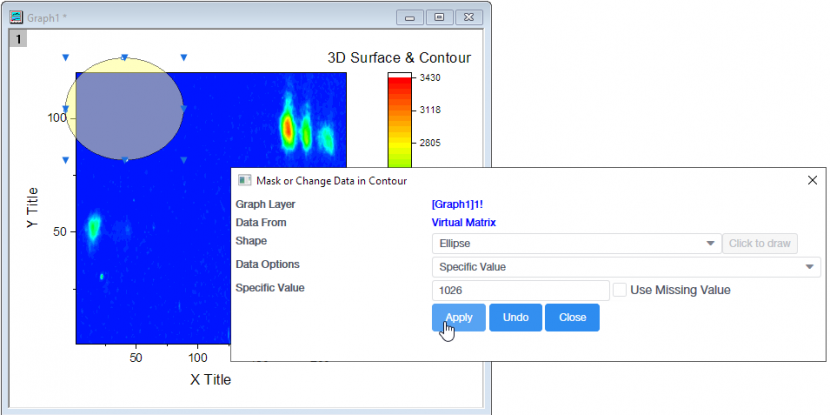
- Select Specific Value as Data Options and set 1026 as Specific Value. Click Apply button.
- Close the dialog. In the Contour graph, the specified value replaced the covered data.