Hinweis:Dieser Abschnitt ist nur in englischer Sprache verfügbar. Wir bitten um Ihr Verständnis.
2.75.2 Identify Data Distribution
Contents
More information:
- Tutorial: Identify Data Distribution
- Algorithm: Identify Data Distribution
- Specifying Input for SPC Tools
Introduction
With the Identify Data Distribution tool, we can
- Examine the distribution of your data, and estimate parameters for the distribution
- Compare the distributions to determine which is the best fit
- Perform transformation for your data to make your data closely resemble a normal distribution.
Origin provides 15 distributions and 3 transformation functions in this tool
Distributions
Symmetric
| Normal | Logistic |
|---|---|
 |
 |
Asymmetric
| Lognormal
3-Parameter-Lognormal |
Log-logistic | Weibull
3-Parameter Weibull |
Gamma | Rayleigh |
|---|---|---|---|---|
 |
 |
 |
 |
 |
Special
| Smallest Extreme Value | Largest Extreme Value | Exponential
2-Parameter Exponential |
Gaussian Mixture | Folded Normal |
|---|---|---|---|---|
 |
 |
 |
 |
 |
Transformation Functions
| Box-Cox Transformation | Yeo-Johnson Transformation | Johnson Transformation |
|---|
Processing
Select the icon to open dialog
Choose Distribution/Transformations
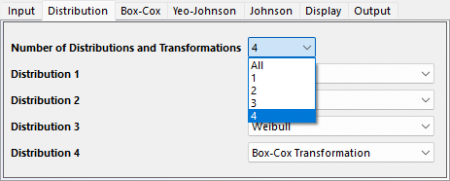
Specify the distribution or transformation methods in the Distribution tab of the dialog. There are 15 distributions and 3 transformation methods in the list.
If selecting All in the Number of Distributions and Transformations dropdown list, all 18 models will be performed on data. Or, you can specify up to 4 models to be fit on your data.
 | If you select All or specify a transformation method, you can further specify the settings of transformations methods in the corresponding tab in the dialog |