3.2 Hysteresis
Summary
Hysteresis app is used to create and plot separate datasets for each segment of hysteresis data.
Tutorial
- Open the sample project example.opju in Origin Apps folder \\Apps\Hysteresis\samples.
- Activate Graph1. Click on the Hysteresis App icon in Apps Gallery window.
- In the Hysteresis Curve Splitter dialog, go to Data tab. Enable Output Graph and set Output as Unstacked Data.
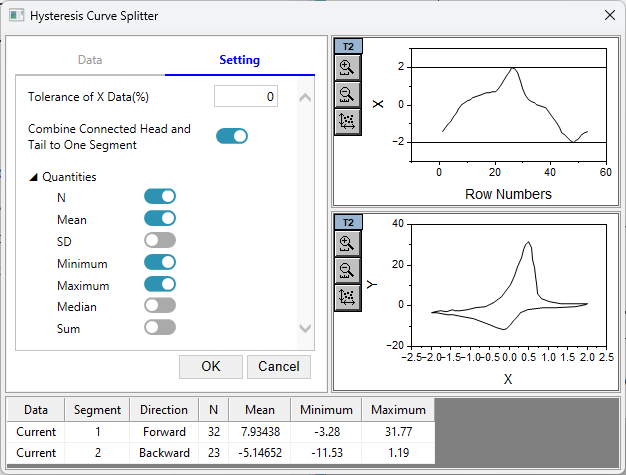
- In Settings tab, check Combine Connected Head and Tail to One Segment.
- Click on the OK button.

Dialog Setting
Data Tab
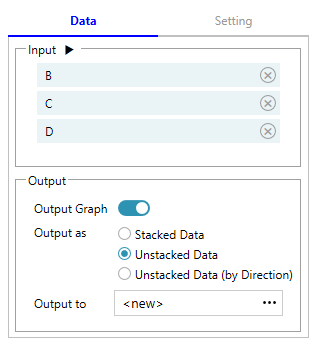
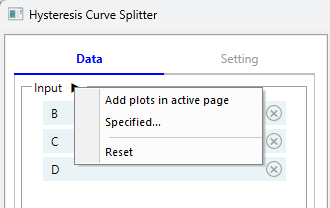
| Input | By default, the app takes all plots in the graph as input. You can remove one by clicking on the close button. The button next to Input allow you to specify the input data as well.
|
|---|---|
| Output Graph | If checked, it will output graph |
| Output as |
|
| Output to | Specify where to output data. By default it will create new workbook. |
Settings Tab
| Tolerance of X Data (%) | It specifies the range of X data to identify each segment. When set to 0, it will identify each segment by the local extreme point in x direction. |
|---|---|
| Combine Connected Head and Tail to One Segment | When checked, if the head of the first segment is connected with the tail of the last one, they will be combined to one segment. It's considered "connected", when the X distance between the head and the tail is less than the average step size of the last segment. |
| Quantities | Specify the quantities to show in bottom table and output. |