1.36 Graph Annotator
The Graph Annotator app can be used to read screen coordinates on the graph.
 
|
Summary
Users may find it time comsuming to manually annotate graphs with labels at certain locations. In this tutorial, we will show an easier approach to annotate graphs with the app Graph Annotator.
Tutorial
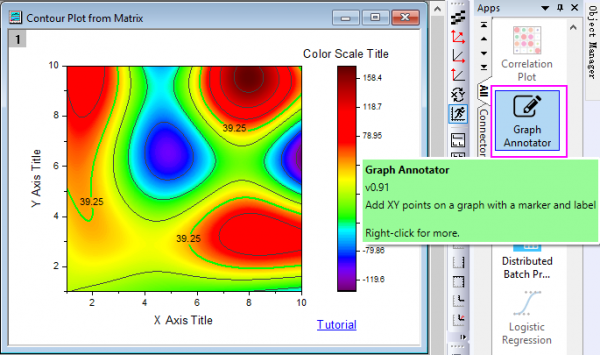
This App is pre-installed in Origin. With a graph window activated, you can find it in the Apps Gallery window and click the app icon to open it, and you also can click the Draw Data toolbar button  to launch it.
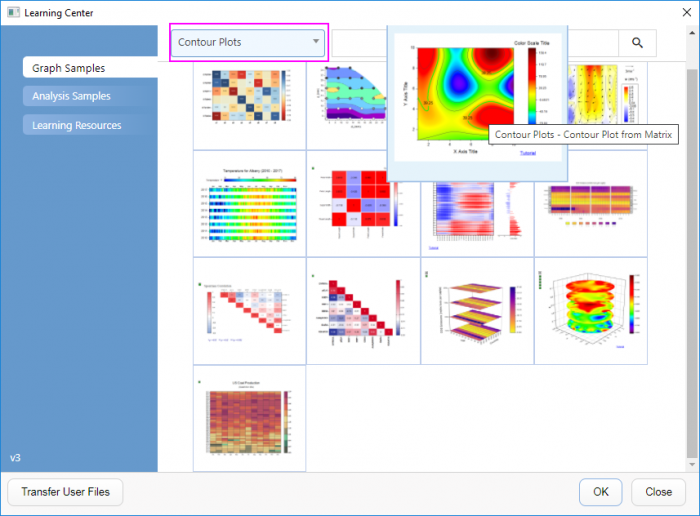
- First, let's open a sample graph. Select Help: Learning Center to open Learning Center, select Contour Plots category to find the sample "Contour Plots - Contour Plot from Matrix". Double-click on the graph icon to open this sample project.
- Activate the graph window "Contour Plot from Matrix" to click the app icon(or Draw Data button) to launch the app.
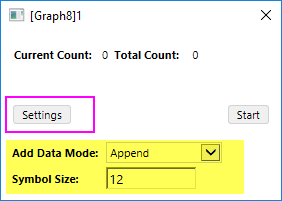
- Click Settings button to expand the dialog, set Add Data Mode to Append and Symbol Size to 12.

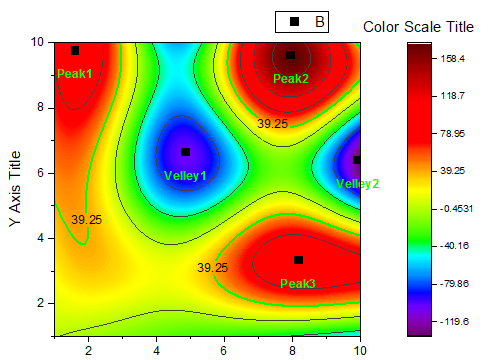
- Double-click on the positions you desired to draw data points onto the contour. And then add labels for all these drawn data points.
- Close the tool. Finally, we get a graph with data points and labels at vally and peak locations on the contour plot. We can customzie the format of the labels and drag-and-drop to reposition them.