2.51 Gel Molecular Weight Analyzer

|
Summary
The App Gel Molecular Weight Analyzer fits a standard curve to relate the known molecular weights of proteins in a set of standards (y-axis) to their relative migration (x-axis), and estimates molecular weights of unknow proteins.
Tutorial
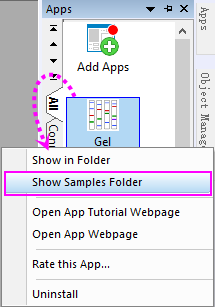
This tutorial is related to the sample file protein gel.jpg which can be found by right-click on the App icon to select Open Samples Folder.
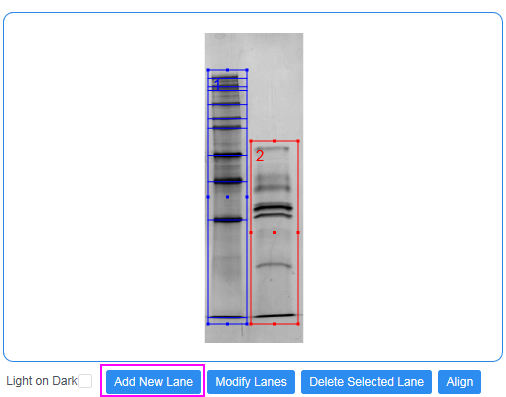
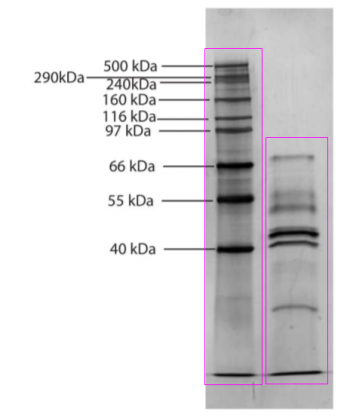
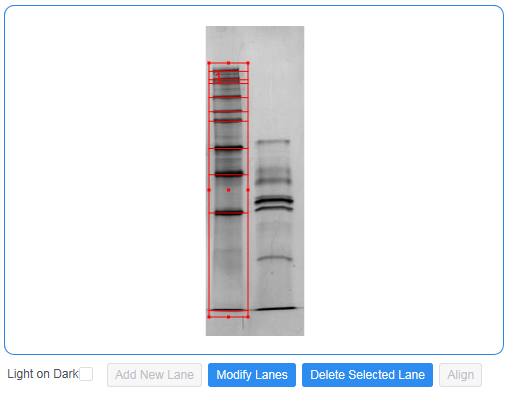
This image contains a standard sample with known molecular weight (the left one)and another sample with unknown molecular weight(the right one).
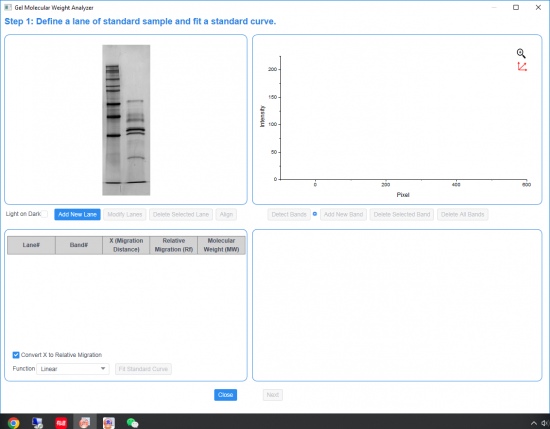
Define a lane of standard sample and fit a standard curve
- Click App icon Gel Molecular Weight Analyzer and select protein gel.jpg and click Open button to open it in the app dialog.
- In the upper left panel, Click Add New Lane and draw a rectangle to define a lane that contains the standard sample.
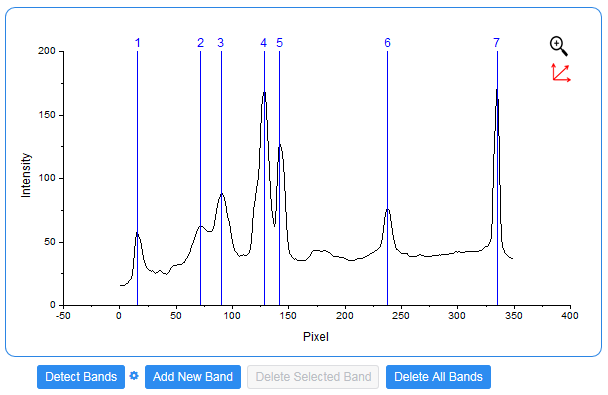
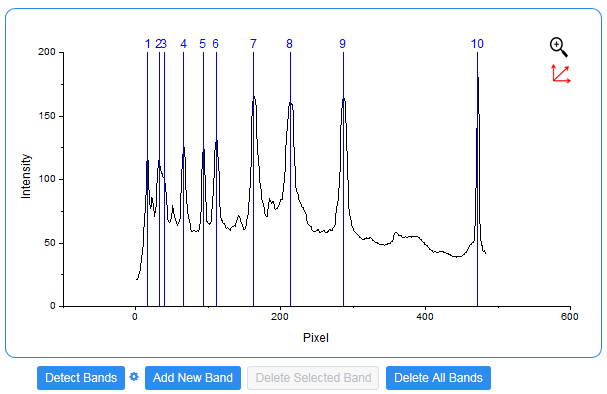
- In the upper right panel, click Detect Bands button to mark bands automatically, and then manually mark the bands which haven't been marked by clicking the Add New Band button to add new bands. The position of the band marks should match with the "molecular weight" annotations in the sketch map above.
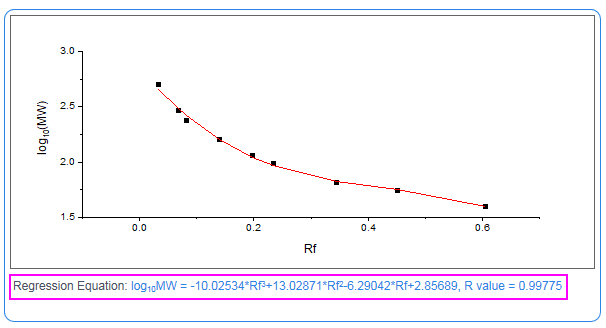
- In the bottom left panel, enter the known molecular weight values into the last column MW of the table(the last row is not in the sketch, so you don't need enter any value). Select Polynomial function and 3th order and click Fit Standard Curve.
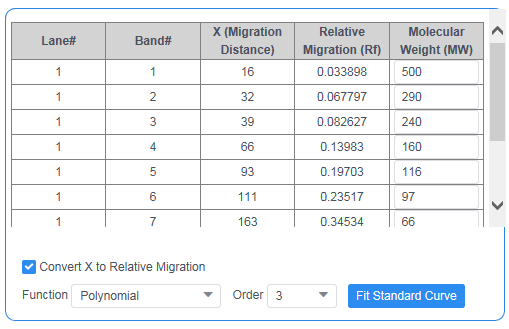
- The check box Convert X to Relative Migration should be checked. Then the last band will be treated as dye front to calculate relative migration (Rf). And, the column Rf will be treated as X and fitted against Log10("MW"). Otherwise it will fit a standard curve of Log10(MW) vs X.
- With the Function drop-down list, you can have multiple tries to find a siutable standard function through the preview in bottom right panel.
- The fitted curve and regression equation are shown in the bottom right panel.
- If you think the fitting is good enough, you can click Next button to save the results and go to the next section "Define a lane of unknown sample and calculate molecular weight. ".
Define a lane of unknown sample and calculate molecular weight
As we have gained the regression equation which determine the relationship between the Relative Migration(X-axis) and Molecular Weight(Y axis) of the samples, we can import the sample with unknow proteins and calculate the molecular weight for the proteins.
- Click Add New Lane and draw a rectangle to define a lane that contains sample with unknown molecular weight in the upper left panel.
- In the upper right panel, just as Step 3 in the section above, mark the positions of bands by detecting bands automatically or adding new bands manually.
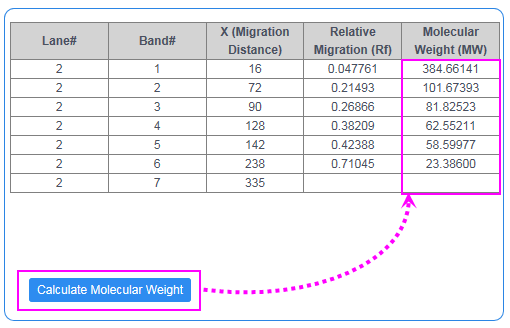
- In the bottom left panel, click Calculate Molecular Weight to determine unknown molecular weight by the regression equation you got in the upper section.
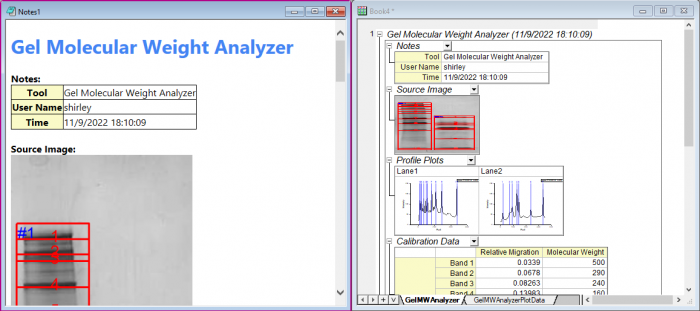
- Check Create HTML Report checkbox and click Output Results to output a report sheet and an HTML report.