2.44 Gaussian Mixture Models (Pro)
Contents
Summary
The Gaussian Mixture Models app can be used to fit Gaussian mixture model using EM method, estimate parameters in the distribution, calculate probability density function and classify test data by posterior probability. It can also find the best model by BIC. It can create several graphs including histogram, probability density function plot, cumulative distribution function plot, Q-Q plot, contour plot and confidence region plot according to the number of variables for input data.
Tutorial
In this example, we will show how to use Gaussian Mixture Models App to fit Gaussian mixture model with three components and classify input data into three groups.
- Import Fisher's Iris Data.dat in the <Origin EXE Folder>\Samples\Statistics\ folder
- Highlight columns A and B. Click the Gaussian Mixture Models icon
 in the Apps Gallery window.
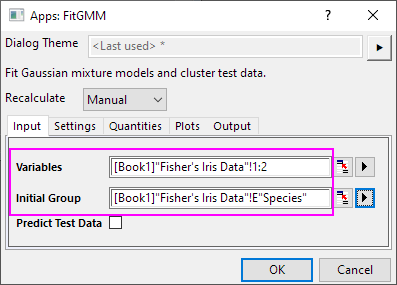
- In the opened dialog, select column E as Initial Group in the Input tab.
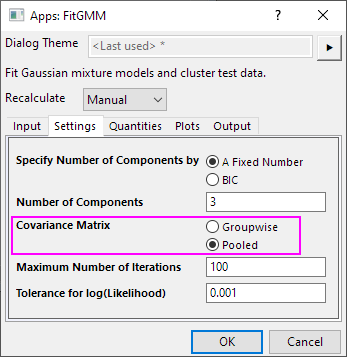
- Choose Pooled for Covariance Matrix in Settings tab. Click OK button.
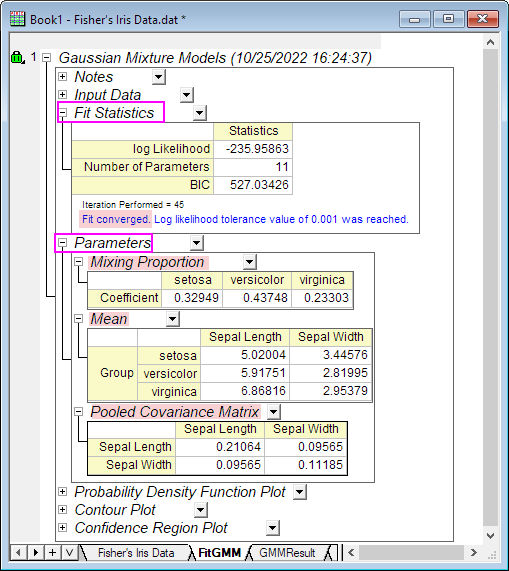
- In the created FitGMM report sheet, Fit Statistics table shows Fit converged.
Expand Parameters branch, you will see mixing proportion coefficients, group means and pooled covarance matrix.
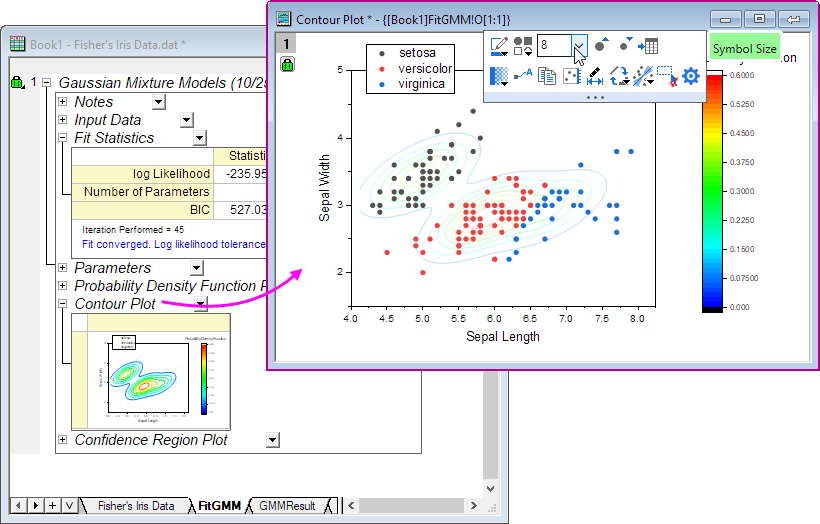
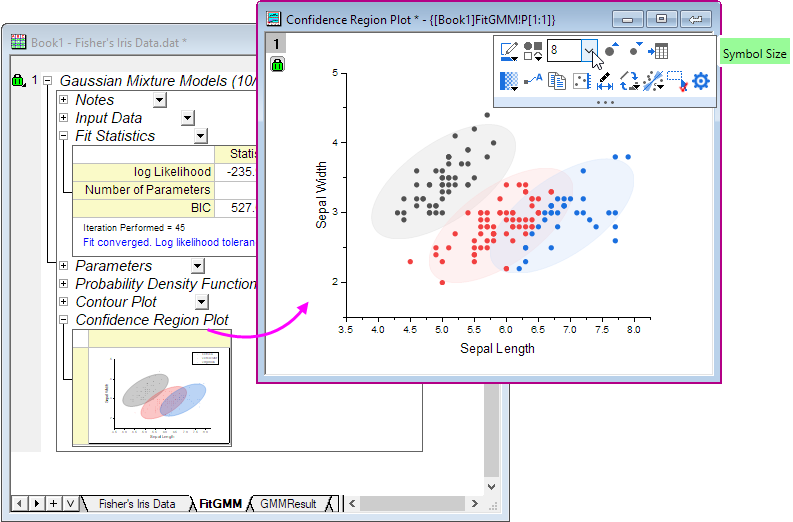
- Expand Contour Plot branch, make the graph window active, choose 8 for scatter plot's symbol size. It shows the contour plot for the Gaussian mixture model's probability density.
- Expand Confidence Region Plot branch, make the graph window active, choose 8 for scatter plot's symbol size. It shows the 95% confidence ellipse for each group level.
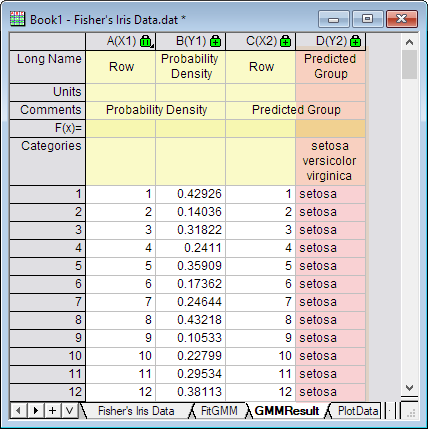
- In the GMMResult worksheet, column D shows predicted group for input data.