2.18 Fourier Self-Deconvolution (Pro)
Fourier-Self-Deconv
Summary
| Notes: The method is also available as a build-in method for peak detection in the Peak Analyzer tool after Origin 2018b
|
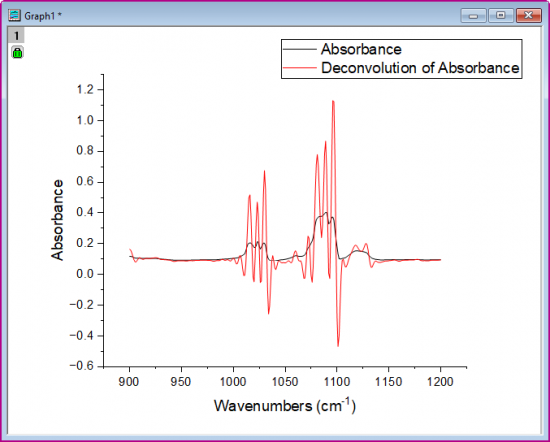
This Fourier Self-Deconvolution app can be used to find overlapping peaks in the spectrum
 | - To use the tool, the X data of spectrum must be evenly spaced. If your X data is not evenly spaced, please use the Interpolation tool to create a uniform linearly spaced interpolated curve from your spectrum first.
- Baseline must be subtracted before using the tool, otherwise extra hidden peaks would be found.
|
Tutorial
- Download the sample file from here to your local PC and open it in Origin
- Highlight column A and B in workbook, or activate the graph window, click the Fourier Self-Deconvolution icon
 from the Apps Gallery to bring up the dialog
- We can clear the Auto check box next to Gamma and adjust the settings. Click Preview button to see how the settings work.
- Gamma: the larger Gamma is, the narrower the deconvolved peak becomes
- Smoothing Factor (0-1): the larger the factor, the smoother the deconvolved spectrum, and the wider the deconvolved peaks
-
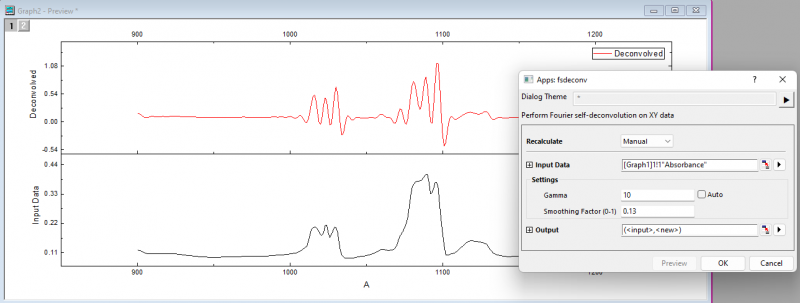
- Set Gamma to be 10 and Smoothing Factor (0-1) to be 0.13, Click OK to create the result.
- After deconvolution with the Fourier Self-Deconvolution method, we can find the hidden peaks in spectrum
-
| Notes: The app only generates the deconvolved spectrum, it won't report the peak values. If what you want is to get the peak values, please use the Peak Analyzer tool.
|