2.42.3.3.3 The Simplex Design Plot
Contents
Introduction
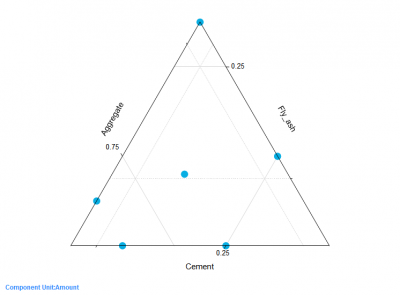
The Simplex Design Plot visualizes a mixture design by plotting design points on triangular (ternary) axes. Each axis represents one mixture component, and the three component proportions sum to 1. Use this plot to see where pure blends, binary blends, interior blends, the centroid, and axial points fall in the formulation space
To Create the Simplex Design Plot
- Activate a worksheet with your mixture design data, which is generated via Generate Mixture Design or Define Custom Design
- Select Statistics: Quality Improvement: Design of Experiment from the Origin menu
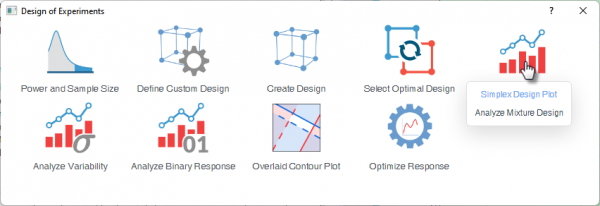
- Select the Analyze Design icon and choose Simplex Design Plot from the context menu
Understanding the Plot
- Vertices: Pure mixtures, where one component is at 100%.
- Edge midpoints/edges: Binary blends of two component.
- Interior points: Complete blends containing all components. The centroid is the equal-proportion blend. Axial points lie along the line from the centroid toward each vertex.
The Simplex Design Plot Dialog Box
| Plot Type | Choose the plot layout.
|
|---|---|
| X/Y/Z Axis | Assign one component to each simplex axis. |
| Component Unit in Plot(s) | Display components as amounts, proportions, or pseudocomponents |
| Hold Components at | Fix process variables or mixture amount at chosen levels when those extra factors are present |
| Include Process Variables | Select to include process-variable settings in the plot. |
| Hold Process Variables at | Fixes process variables at chosen levels unless you choose to plot all level combinations. |
| Hold Mixture Amount at | Available only when a mixture amount variable exists. (Select Multiple Totals on the Components tab when creating mixture desgn)
Fixes the total amount at one level and plots only runs at that amount |
| Point Label | Choose a label for plotted points:
|