1.23 Chromaticity Diagram
Summary
The Chromaticity Diagram app can be used to:
- Open a workbook template with CIE 1931 color space chromaticity diagram and CIE 1976 UCS (uniform chromaticity scale) diagram.
- Calculate CIE XYZ from photoluminescence spectra and add PL data to the chromaticity diagram.
- Plot L*a*b* data in 2D, 3D and convert L*a*b* data to CIE 1931 xyY.
- Convert XYZ to L*a*b*, XYZ to RGB and xyY to XYZ.
Tutorial
Download the Chromaticity_Diagram_Sample.zip file.
Open Chromaticity Diagram Template to add data
- Select the Chromaticity Diagram icon
 in the apps gallery window. Click the first button
  of this app toolbar., and it will open a workbook template.
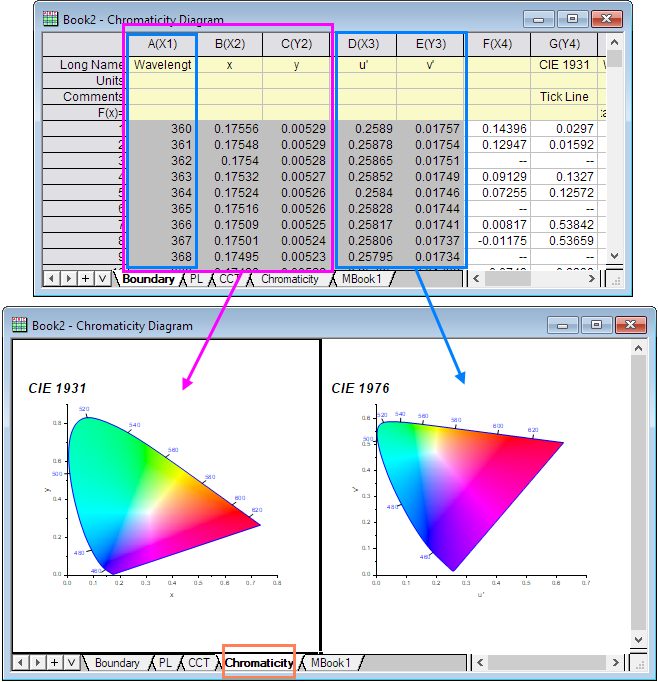
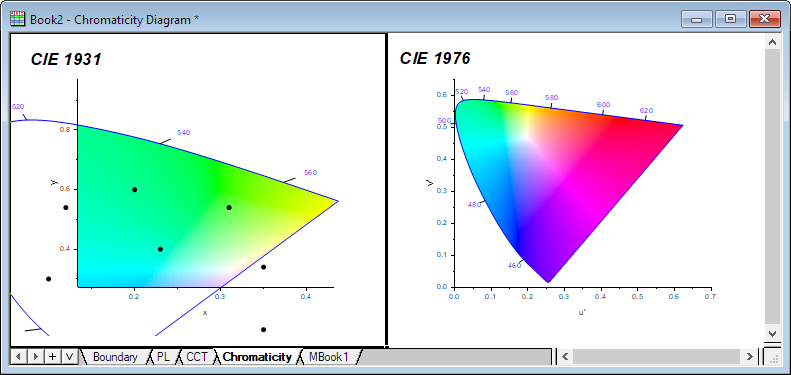
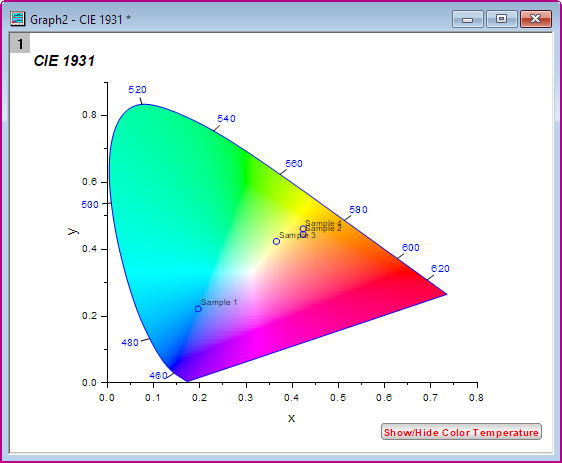
- Go to Chromaticity sheet. Two graph templates (CIE 1931 and CIE 1976) are inserted. The boundary of the chromaticity can be found in the Boundary worksheet. Column A, B and C are boundary data for CIE 1931 and column A, D and E are boundary data for CIE 1976.
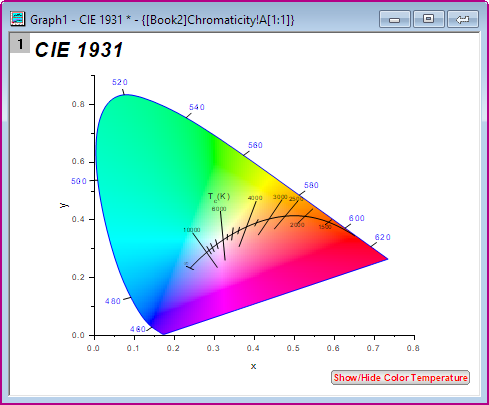
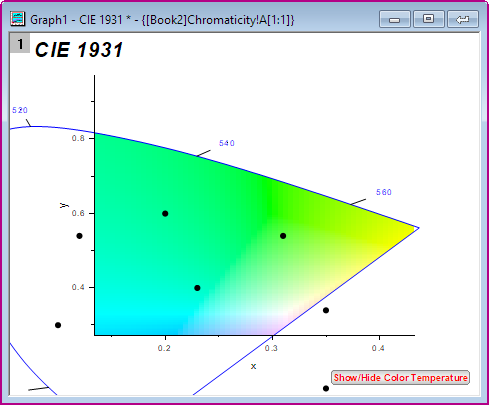
- Double click on the worksheet cell, you can open the graph window . If you want to show color temperature in CIE 1931, click Show/Hide Color Temperature button on the bottom right of the graph. You can also add your own data to the graph template.
- To know the distribution in the chromaticity diagram, you can import Data.dat (in the download file) into Origin, and then drag and drop the data directly into the template.
- Double click the graph to open the Plot Details dialog, change the Plot Type from Line to Scatter. And change the symbol type. Click OK.
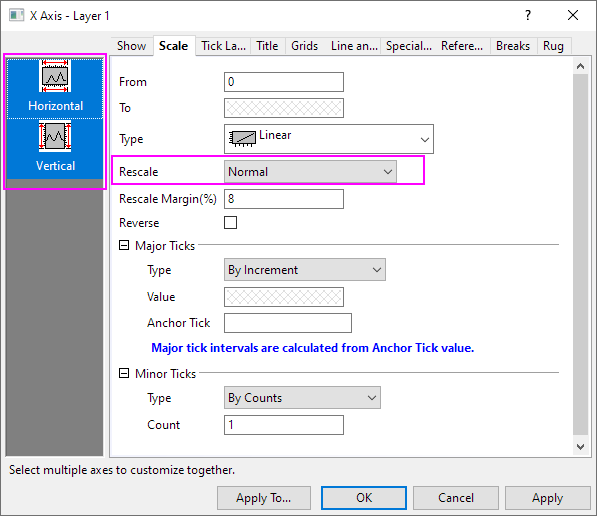
- Double click the axis which will open the Axis dialog. Select Both Horizontal and Vertical, and select Normal under Rescale drop-down list in the Rescale tab. Click OK.
- Now select the Scale In icon
 and drag the area of interest to zoom in.
- Select the back arrow icon which will add the embedded graph back into the Chromaticity worksheet.


Chromaticity Diagram with PL
If you have photoluminescence spectral data and want to know its color in terms of the standard observer.
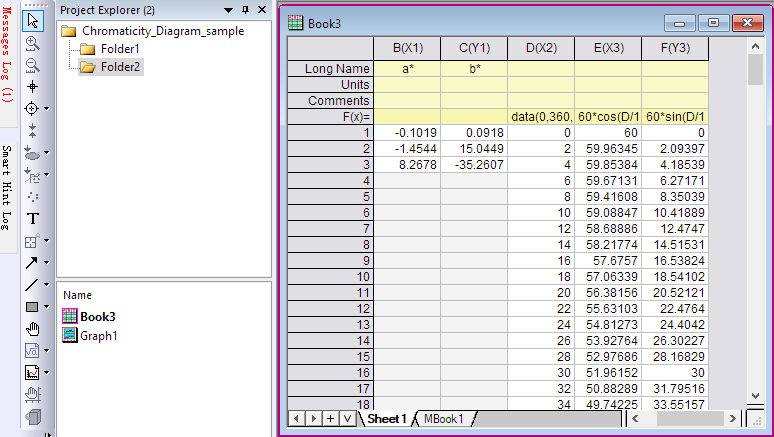
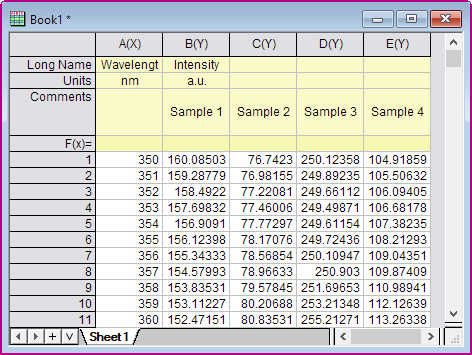
- Open Chromaticity_Diagram_sample.opju project (in the download file), select the Book1 in the Folder1 and highlight all columns.
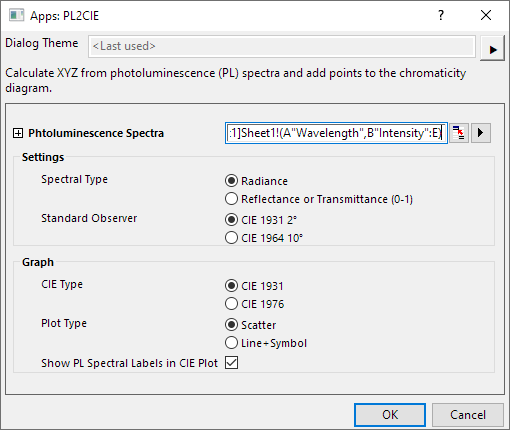
- Select the PL button
 to open the dialog. Confirm the dialog setting as below image:
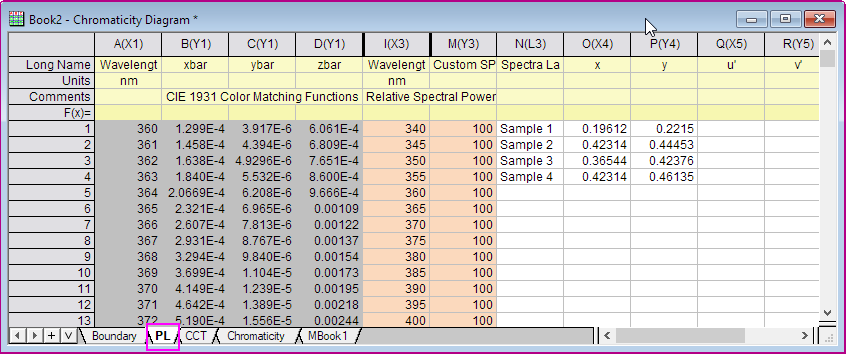
Then click OK. You will get the each PL spectrum corresponds to a point in the chromaticity diagram. - The workbook data that refers to this graph is automatically hidden in the project. You can quickly view the Workbook by going to the Project Explorer and activating the Chromaticity Diagram Workbook. Select the PL worksheet tab. Here the first 4 columns contain the CIE standard observer color matching functions that were used to calculate the xy coordinates.
L*a*b* Plot
- Select Folder 2 in the upper panel of Project Explorer. Select Book3, highlight Column B and C, and click the Lab button
 of this App toolbar.
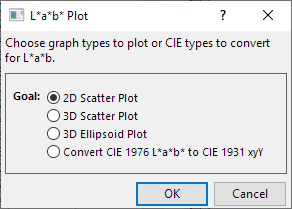
- In the L*a*b* Plot dialog, select 2D Scatter Plot option to open the plotLAB2 dialog.
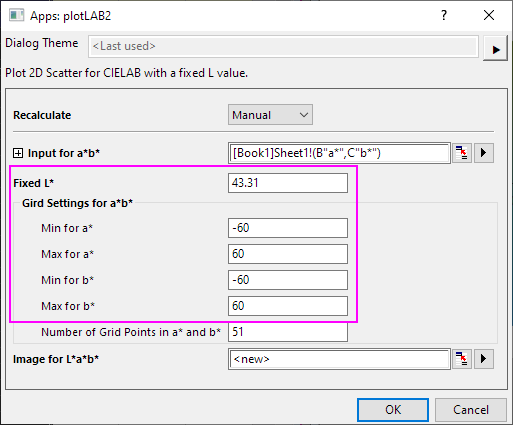
- In the plotLAB2 dialog, follow the setting as below image:
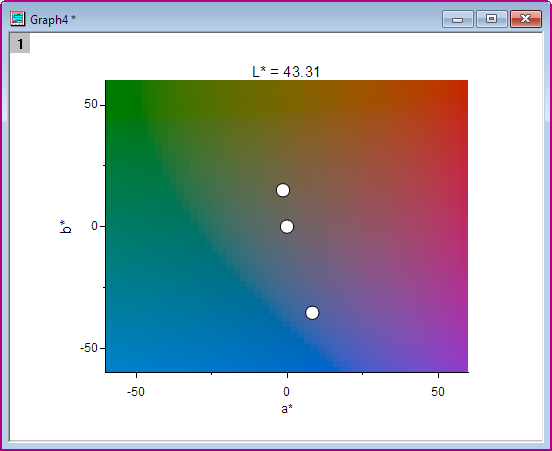
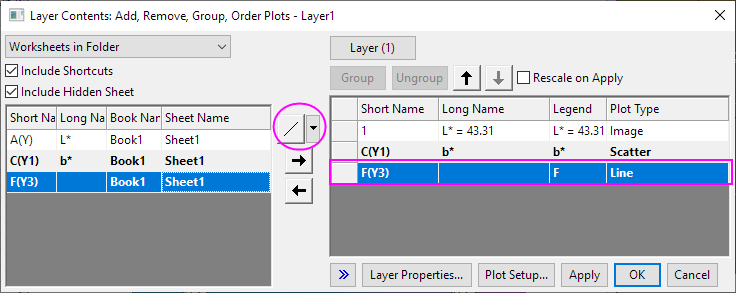
This graph is created: - Select Graph: Layer Contents to open the dialog. Set Plot Type to Line, select Column F and add to right panel. Click OK
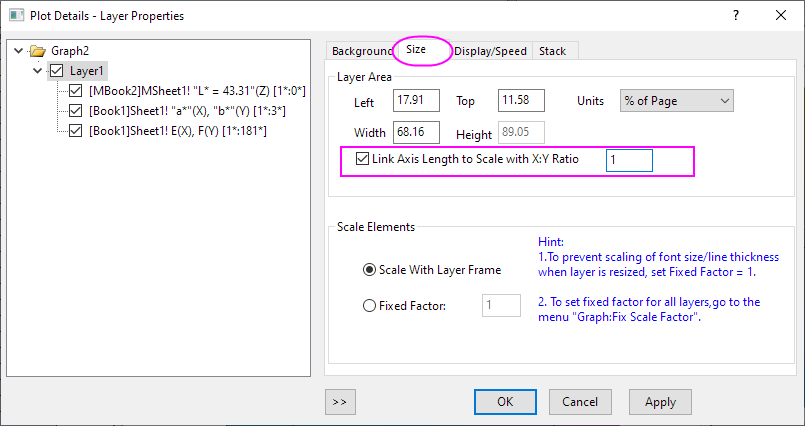
- Double-click on the graph to open Plot Detail dialog. Go to Size tab of Layer level, check Link Axis Length to Scale with X:Y Ratio option.
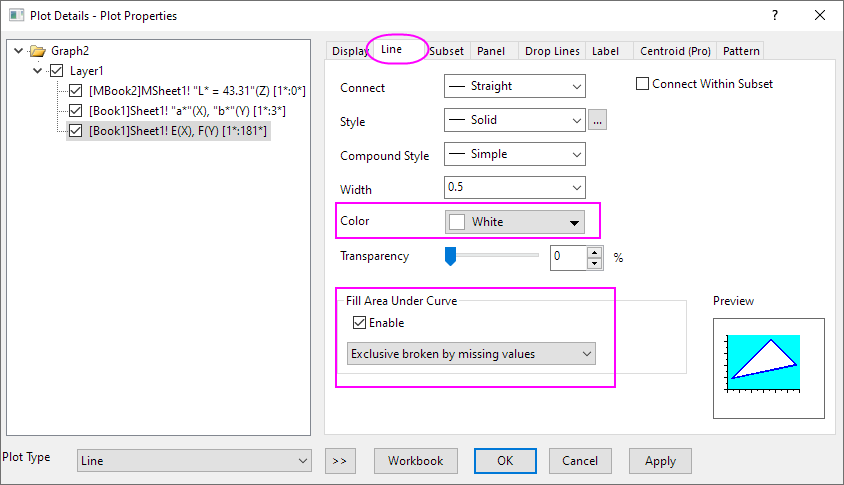
- Go to Line tab of the Line plot level. Set Color to White. Check Enable option under Fill Area Under Curve, and select Exclusive broken by missing values in the drop-down list.
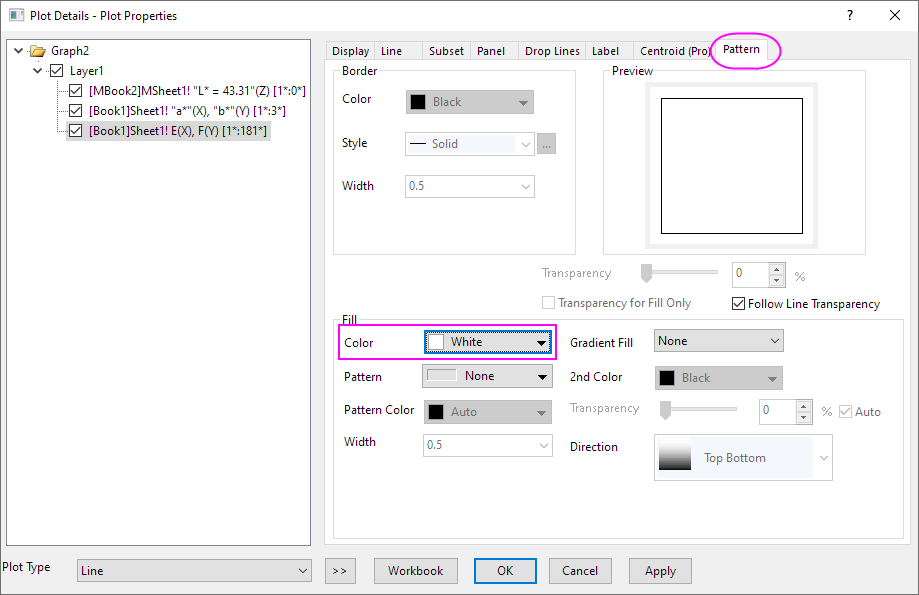
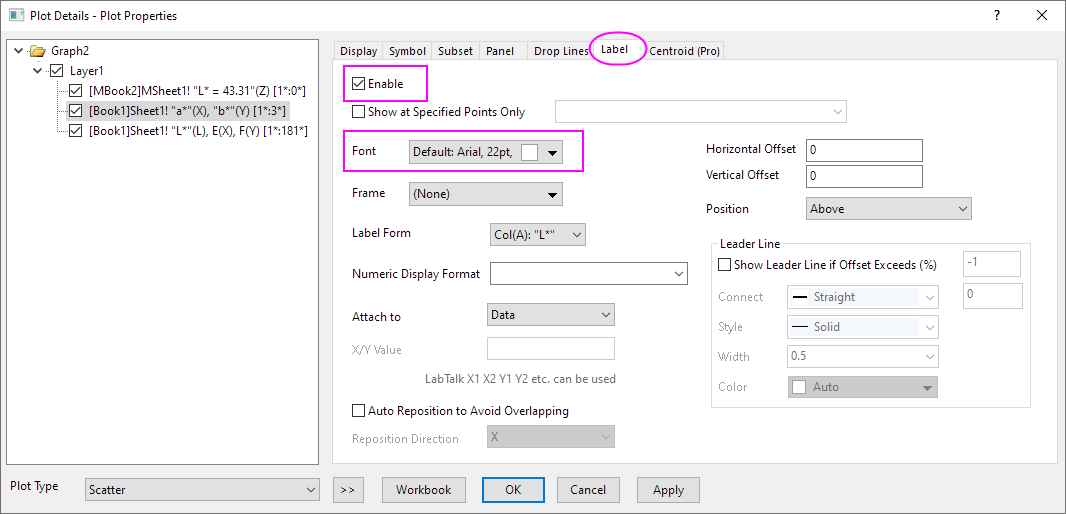
In the Pattern tab, set Fill Color to White. Click OK. - Go to Label tab of Scatter Plot level. Check Enable option. Set Font Color to White, and then select Col(A):"L*" in the Label From drop-down list.
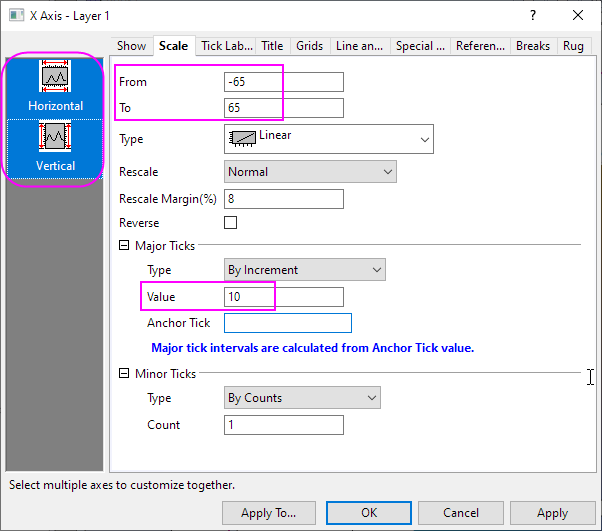
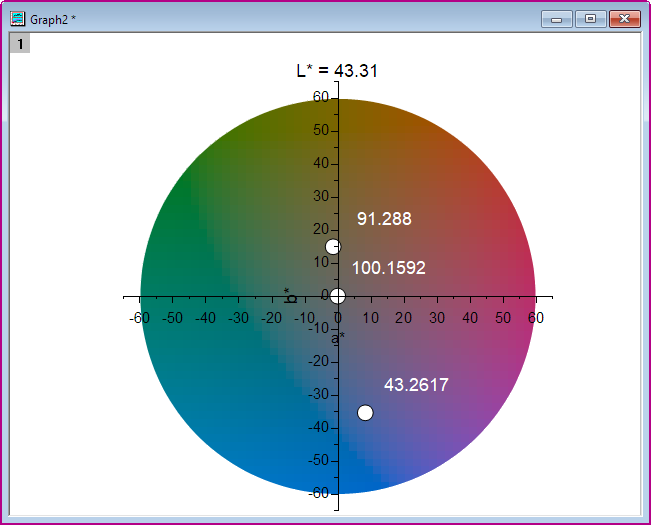
- Double-click on the Axis to open the Axis dialog. In the Scale tab, select Both Horizontal and Vertical, then set scale From = 65 and To = -65. Set Major Tick Value =10.
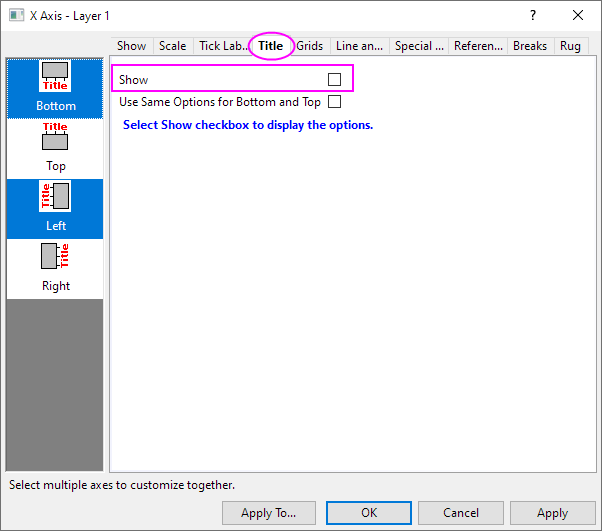
Go to Title tab. Uncheck Show option.
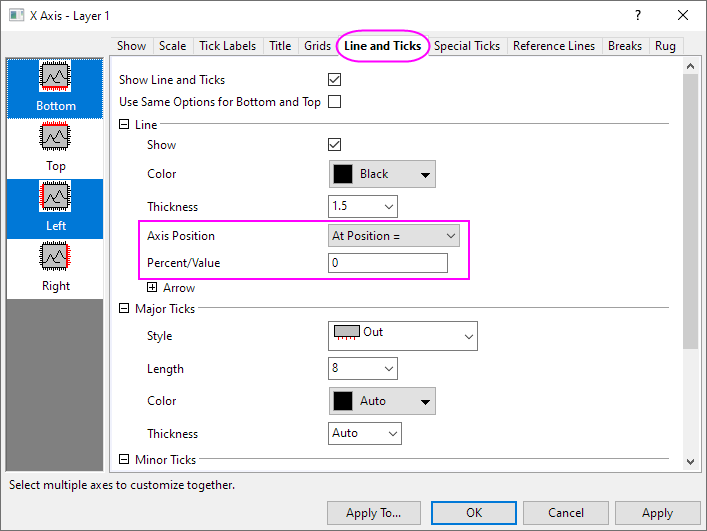
Go to Line and Tick tab. Select At Position= in the Axis position the drop-down list, and enter 0 Percent/Value. Click OK. - Draw the symbol label to the suitable position. Finally, you will get the graph like this: