2.42.4.1 Analyze Variability
Contents
Introduction
Analyze Variability in DOE examines how experimental factors influence not just the average response (location), but the spread or consistency of that response (dispersion). Standard DOE optimizes mean performance; variability analysis ensures that optimum is also stable and robust.
Use this analysis when your design includes replicates (multiple observations per run) and you suspect that some factors affect consistency rather than just the average.
Supported design types
- Factorial designs (2-level, Plackett-Burman)
Input Data and Summarizing
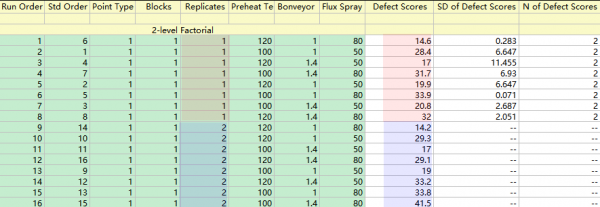
The input data for DOE variability analysis requires replicate observations — multiple independent measurements taken at each combination of factor settings.
The data can be arranged in two ways:
Replicates Stored in Separate Adjacent Columns
- Activate the worksheet containing your factorial design data (generated via Generate Factorial Design or Define Custom Design), in which the replicate measurements stored in separate adjacent columns
- Select Statistics: Quality Improvement: Design of Experiment from the Origin menu
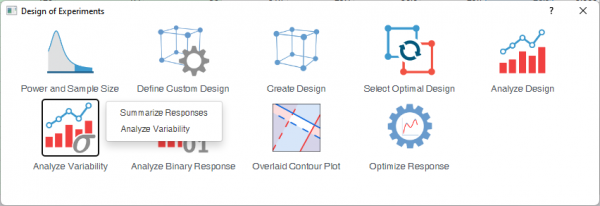
- Click the Analyze Variability icon and choose Summarize Response from the context menu
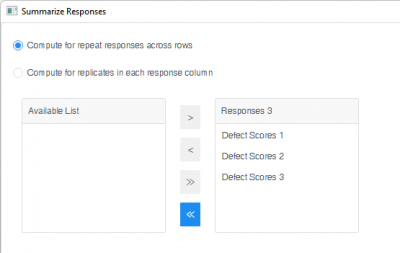
- In the opened dialog, select Compute for repeat responses across rows and select the responses, then click OK.
- This generates the SD, N and Mean column


Replicates Stacked inside Individual Columns
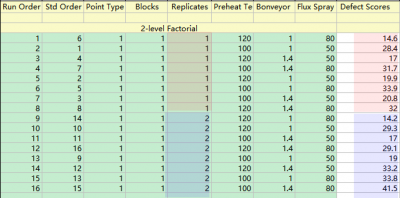
- Activate the worksheet containing your factorial design data (generated via Generate Factorial Design or Define Custom Design).
- Select Statistics: Quality Improvement: Design of Experiment from the Origin menu
- Click the Analyze Variability icon and choose Summarize Response from the context menu
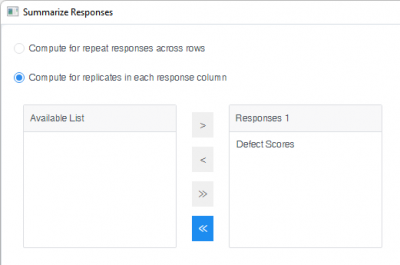
- In the opened dialog, select Compute for repeat responses across rows and select the responses, then click OK .
- This generates the SD and N columns
Run the Analysis
- Select Statistics: Quality Improvement: Design of Experiment from the Origin menu
- Click the Analyze Variability icon and choose Analyze Variability from the context menu
- In the Model tab of the dialog, specify the Response(Standard Deviation) column, and Number of Repeats/Replicates column.
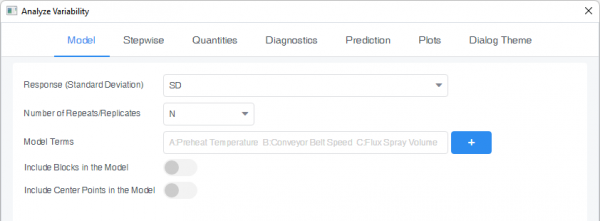
The remaining options in the analysis dialog are the same as Analyze Factorial Design dialog
Results of Analyze Variability
Analyze Variability fits a model to the natural log of the standard deviation (or variance). The session-window tables parallel those from standard factorial analysis, with two adaptations: the response is log-transformed spread rather than the mean, and the coefficients table includes Ratio Effect columns. The output tables are otherwise largely similar, with the following exceptions.
For detailed guidance on interpreting general DOE results, See the Interpreting DOE Results
Coded Coefficients
The table, available on the report sheet, shows how each factor affects the log-standard deviation.
| Effect | Change in ln(SD) when the factor moves from its low (-1) to high (+1) level. |
|---|---|
| Ratio Effect | exp(Effect). The multiplicative factor by which the actual standard deviation changes at the high level versus the low level. |
| Value | The regression coefficient |
| Prob>|t| | P-value. Values below 0.05 indicate a statistically significant dispersion effect. |
| VIF | Variance inflation factor. Values much larger than 1 suggest multicollinearity among model terms. |
Means Table
This table, available on the report sheet, displays the marginal fitted means for each factor level in the variability model. Because the analysis models the natural log of the standard deviation, the "Fitted Mean" column is in ln(SD) units, while "Fit (Original)" back-transforms that value into the predicted standard deviation in original measurement units.
| Value | The actual factor level setting (uncoded units). |
|---|---|
| Fitted Mean | Predicted ln(SD) at that factor level, averaged across all other factors. |
| SE Mean | Standard error of the fitted mean. |
| Fit (Original) | exp(Fitted Mean) - the predicted standard deviation in original units. |
Diagnostics
The diagnostics are displayed in fitted result worksheet, named DOEFittedResultItalic text
Fitted Values
| Fitted Values (Ln Units) | Predictions in the transformed scale |
|---|---|
| Fitted Values (Original) | exp(fitted ln value), giving the predicted SD in the original measurement units. |
Residuals
| Ln | Residuals computed in the log-transformed scale: observed ln(SD)-fitted ln(SD) |
|---|---|
| Ratio | The ratio of observed to fitted standard deviation in original units, equivalent to exp(Ln residual)
|
| Standardized Ln | The Ln residuals divided by their standard error (studentized or standardized form). Use these to identify outliers objectively.
|