2.42.3.1.5 The Analyze Taguchi Design Dialog Box
Contents
Supporting Information
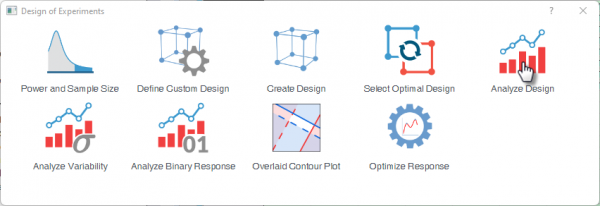
To open the Analyze Design dialog
- Activate a worksheet with your experimental design data which is generated via Generate Design or Define Custom Design
- Select Statistics: Quality Improvement: Design of Experiment from the Origin menu
- Select the Analyze Design icon
 | Topics for Further Reading:
|
Model
| Response | Select the column containing the measured outcome variable. |
|---|---|
| Model Terms | Specify which effects to include in the fitted model. Click the + button to open a dialog to select model terms |
Settings
Static Taguchi Design
| Signal to Noise Ratios | Selects the S/N ratio formula according to the optimization goal for the response.
|
|---|---|
| Use Adjusted Formula | Available only for Nominal is best options.
Toggles whether to use an adjusted formula. When enabled, the software applies the displayed formula below instead of the standard formulation. |
| Formula | Displays the mathematical formula corresponding to the selected S/N ratio type. |
| Use Ln(s) for All Standard Deviation | Toggles whether to use the natural logarithm of the standard deviation, ln(s), as the measure of variability across all experimental runs. |
Dynamic Taguchi Design
The settings below determine how the dynamic response is modeled and how the S/N ratio is computed, which directly affects factor optimization in the subsequent analysis.
| Fit Lines | Specifies how the ideal function (response versus signal) is fitted. Three options are available
|
|---|---|
| Use Adjusted Formula | Toggles whether to use an adjusted formula for the dynamic S/N ratio or sensitivity calculation. When enabled, the software applies the displayed formula below instead of the standard formulation. |
| Formula | Displays the mathematical formula |
| Use Ln(s) for All Standard Deviation | Toggles whether the natural logarithm of the standard deviation, ln(s), is used as the measure of variation across all experimental runs. This is commonly applied in Taguchi analysis to stabilize variance and linearize the relationship between the mean and variation. |
Quantities
Select which numerical results are reported after fitting the model. Refer to the interpreting results page for details of the statistics
| Display Response Table | Selects which summary statistics to show in the response table. Refer to the Response table section for more details of the results. This typically includes
|
|---|---|
| Fit Linear Model | Chooses which response metric to use when fitting the linear model to the control factors. The same three options (Signal to Noise Ratios, Slopes/Means, Standard Deviations) are available. Three tables are included in the results of fit linear model for each response metric (Coefficients Table, Statistics and ANOVA) |
| Coefficients Table | Controls which regression coefficients appear in the output. Refer to the interpreting results page for details of the statistics
|
| ANOVA Table | When enabled, displays the Analysis of Variance table, which partitions the total variation into model, residual, and lack-of-fit components. It provides the overall F-test and p-value to assess whether the model explains a significant portion of the variation. |
| Fit Statistics | These metrics summarize how well the model fits the data. Refer to the interpreting results page for details of the fit statistics
|
Response Summary
Control which statistics to be reported in the response summary worksheet. Refer to response summary section of the interpreting reuslts page for more details of the statistics.
| Signal to Noise Ratios | Displays the S/N ratios for the experimental runs |
|---|---|
| Means | Available only for Static Taguchi Design.
Displays the mean response for each combination of control-factor levels |
| Coefficients of Variation | Available only for Static Taguchi Design.
Compute and store the coefficient of variation for each experimental run |
| Slopes | Available only for Dynamic Taguchi Design.
Displays the slopes of the fitted response-versus-signal relationships. |
| Intercepts | Available only for Dynamic Taguchi Design.
Displays the intercepts of the fitted response-versus-signal relationships. |
| Standard Deviations | Displays the standard deviation of the response for each combination of control-factor levels. |
| Ln of Standard Deviations | Displays the natural logarithm of the standard deviation. |
| Design Matrix | Displays the design matrix used for the analysis, including the factor settings and corresponding experimental runs. |
Diagnotics
The Diagnostics tab controls which residual and fitted-value outputs are generated in the DOEFittedResult worksheet , for checking model assumptions and spotting unusual observations.
Refer to the diagnotics section in the interpreting results page for details of the fitted results and residuals
| Fitted Values | When enabled, reports the predicted response value for each run based on the fitted model. These are the values the model expects, used to compare against actual observations. |
|---|---|
| Residuals | Select which type of residual values to be output
|
| Hi (Leverage) | How far a run's factor settings are from the design center. Higher values = more potential to pull the fit. |
| Cook's Distance | How much the fitted values change when that run is removed. |
| DFITS | Combines leverage and residual size to measure overall influence on the fit. |
Prediction
The Prediction tab specifies which response characteristics are included in the DOEFindYfromX sheet, which contains prediction results for the selected factor settings.
Refer to the Model Prediction - Find Y from X page for details on the generated worksheet.
 Note: Only the response characteristics selected for output in the Quantities tab can be selected for prediction
| Signal to Noise Ratios | Toggles the prediction calculation on or off. When enabled, a worksheet named DOEFindYfromX is generated. In the worksheet, enter factor values into the respective columns, the predicted response (Y) are calculated automatically. |
|---|---|
| Means | Available only for Static Taguchi Design.
Toggle to predict the mean response for each combination of control-factor levels |
| Slopes | Available only for Dynamic Taguchi Design.
Toggle to predict the slopes of the fitted response-versus-signal relationships. |
| Standard Deviations | Toggle to predict the standard deviation of the response for each combination of control-factor levels. |
| Ln of Standard Deviations | Toggle to predict the natural logarithm of the standard deviation. |
Plots
The Plots tab lets you select which diagnostic and exploratory graphs to generate from the fitted model.
Note: The available Plots For options depend on the response characteristics selected in the Quantities tab.
| Plots | Select the plots to generate from the fitted model. Refer to the Plots in DOE page for details of the plots
|
|---|---|
| Plots For | Specifies the response characteristic for which the selected plots are generated. The available characteristics can include:
|
| Residual Type | Choose the residual type to be used for the residual plot. Refer to the diagnotics section in the interpreting results page for details of the residuals
|
Dialog Theme
Save and load the settings of the dialog. Use this to store frequently used factor configurations, design options, or output preferences, then recall them for future designs without re-entering all values.